
Skip to content
Back

Pivot Points - Fibonacci Indicator Formula

Updated

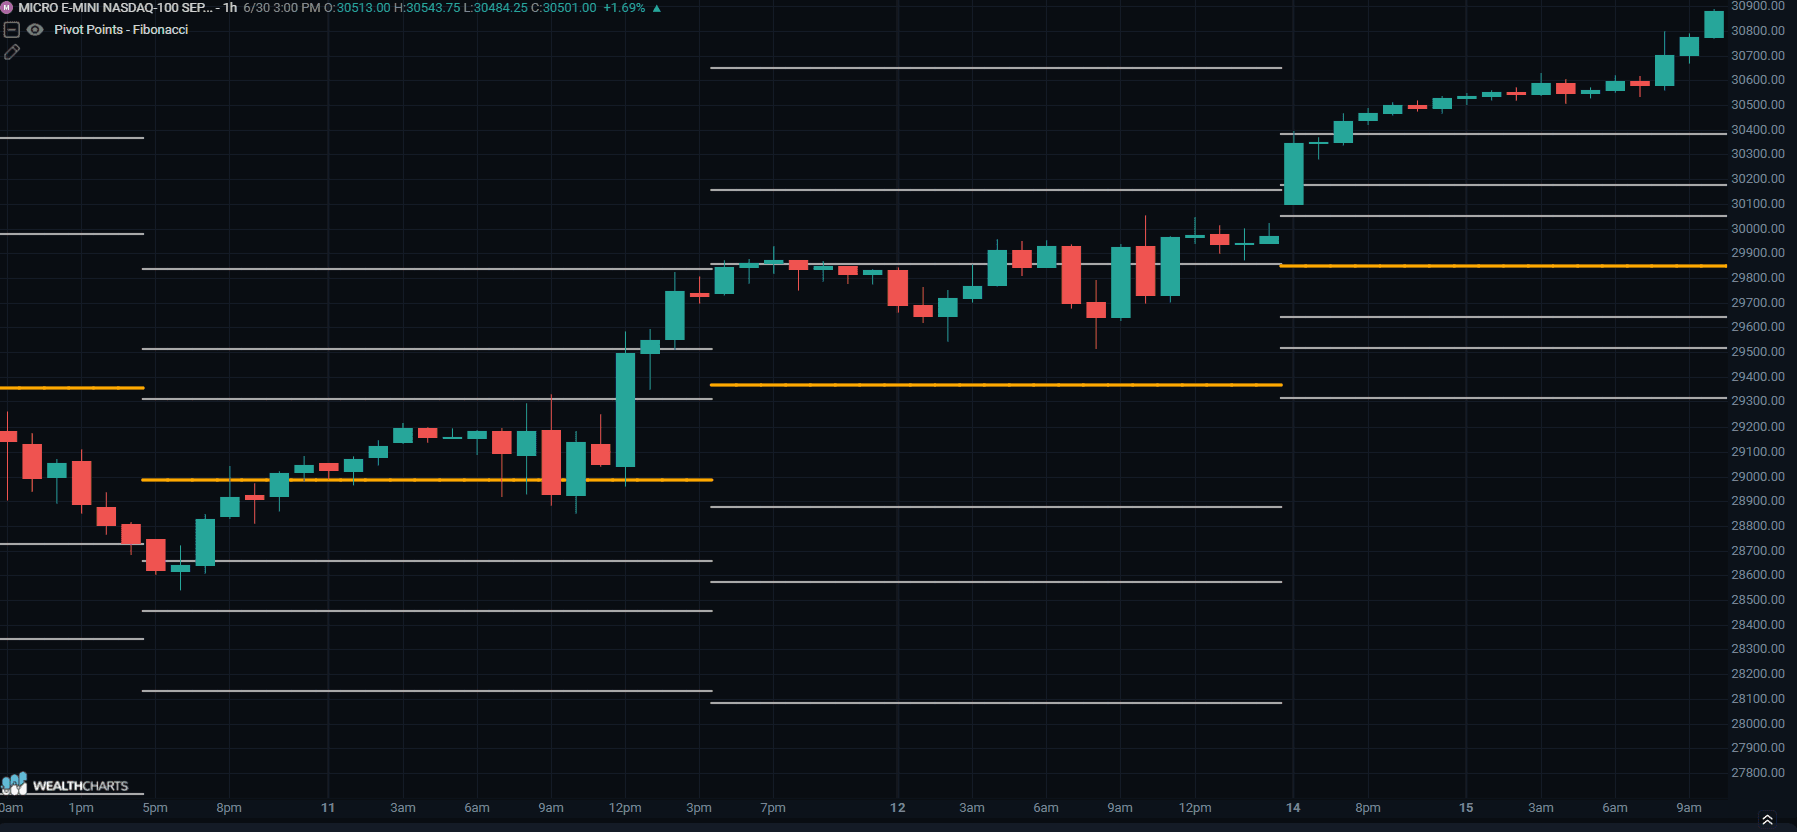
Fibonacci Pivot Points offer a slight variation from the standard Pivot Point. They take a standard Pivot Point calculation and multiply it by a corresponding Fibonacci retracement level. Many traders use Pivot Points, Fibonacci ratios and Fibonacci levels and the theory is that prices can naturally gravitate to those levels.


When the price of an asset is above the Pivot Point during the trading day, this is considered to be a bullish sign.


When the price of an asset is below the Pivot Point during the trading day, this is considered to be a bearish sign.


Additionally, there are support and resistance levels that are derived from the Pivot Point and Fibonacci ratios: Support 1 (S1), Support 2 (S2), Support 3 (S3) and Resistance 1 (R1), Resistance 2 (R2), Resistance 3 (R3).


Calculation:


​R3 = P + ( High - Low ) * 1.0


​R2 = P + ( High - Low ) * 0.618


​R1 = P + ( High - Low ) * 0.382


​P = ( High + Low + Close ) / 3


S1 = P - ( High - Low ) * 0.382


S2 = P - ( High - Low ) * 0.618


S3 = P - ( High - Low ) * 1.0


The S1, S2, S3 and R1, R2, R3 levels can be used as support and resistance for reversals but can also be used as a continuation of the trend. If an asset's price is rising and moves above R1, it could help signify the uptrend and a continuation to R2 would be possible.


PIVOT POINTS - FIBONACCI.png
Was this helpful?

Related guides

Still stuck? Contact support — phone, chat or email, staffed while the market is open.

WealthCharts is a technical and fundamental analysis and trading research platform, that also provides a strong social community of active investors from all over the world at various experience levels. Any opinions, investment or trade grade ratings, chats, messages, news, research, trade alerts, analyses, prices, or other information contained on WealthCharts are provided as general market information for educational and entertainment purposes only. WealthCharts does not provide any trading or investing advice to buy or sell any investment product. WealthCharts does not endorse or recommend any trading or investing ideas, or recommendations for any investment class that is featured or discussed on the platform. We provide a platform to assist you in making your own decisions. Our platform, analysis and market data is provided 'as-is' and is without warranty whatsoever. Please see our Terms of Use, Privacy Policy, and Market Data Disclaimers for complete details and disclaimer language. Always do your own careful due diligence and research before trading or investing, and be sure to consult your registered financial representative or advisor before trading or investing in anything.

WealthCharts is a separate and distinct legal entity from the prop firms mentioned on this page. There is no joint venture, partnership, or legal affiliation between WealthCharts and these prop firms. Any collaboration or integration between the two entities is provided solely for user convenience and does not imply any form of legal or business partnership.

Furthermore, WealthCharts and its subsidiaries are not affiliated with, do not endorse, and assume no responsibility for any third-party platforms, trading methodologies, newsletters, or similar services that are not exclusively produced and distributed by WealthCharts. Users are encouraged to perform their own due diligence before engaging with any external service or provider.

© 2026 WealthCharts™. All Rights Reserved. Trading involves risk.