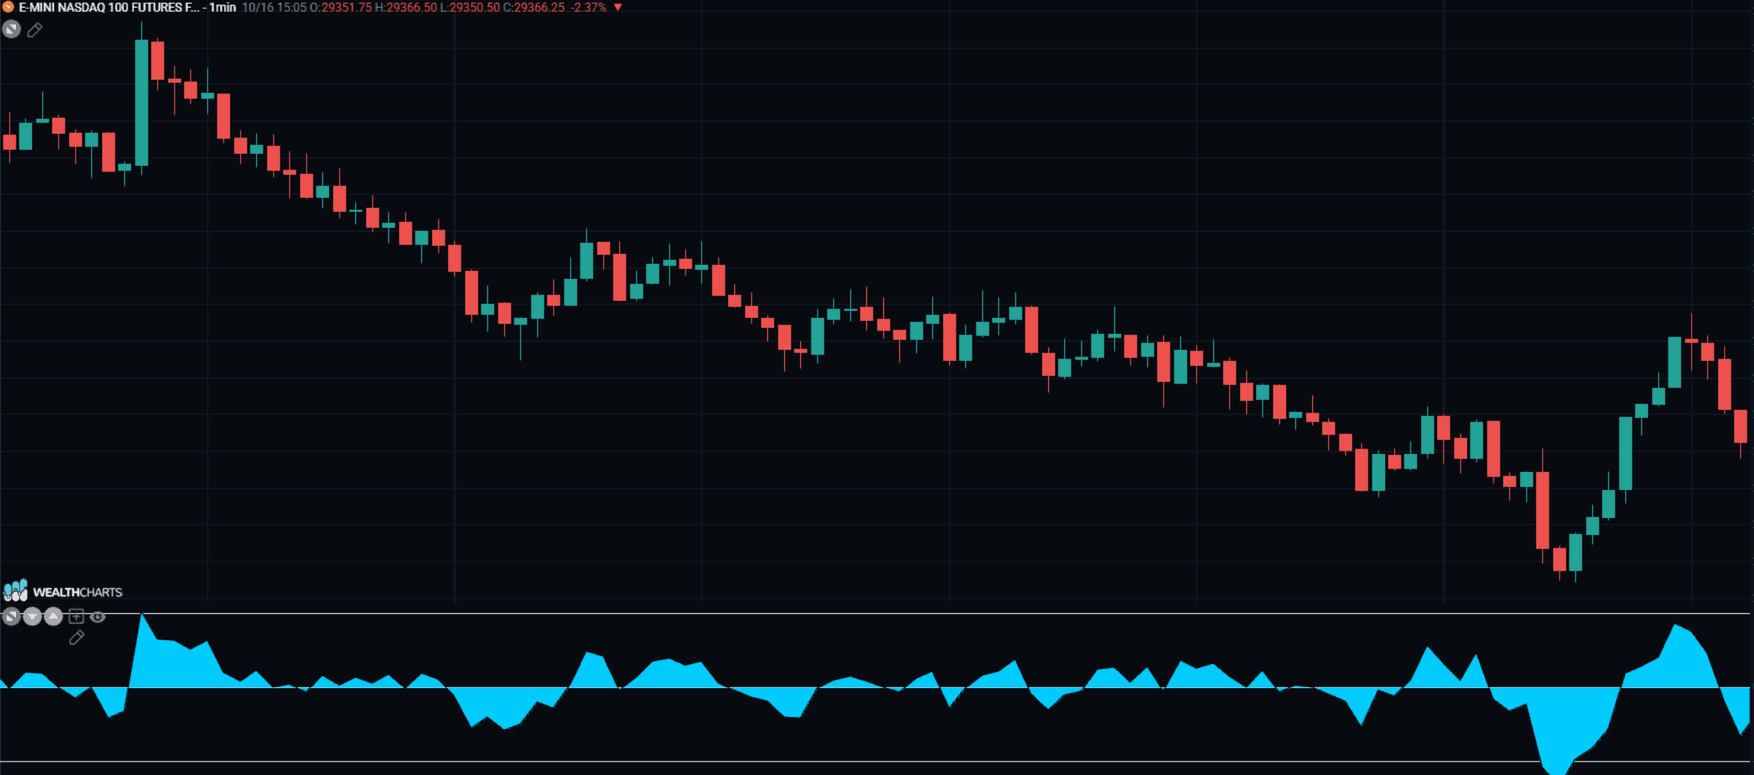
Detrended Price Oscillator (DPO) - Indicator Formula
Updated
Calculating the Detrended Price Oscillator (DPO)
The DPO compares price to a simple moving average (SMA), with one twist. Most price-vs-SMA indicators use the latest price. The DPO instead compares the SMA to the price that sits in the middle of the SMA’s lookback window.
DPO = Price − X-period SMA from (X/2 + 1) periods in the future
Here, X is the DPO’s period. A 20-day DPO uses a 20-day SMA shifted by 11 periods (20 ÷ 2 + 1 = 11). Shifting the SMA 11 days to the left puts it near the middle of the window it was calculated from. So the DPO(20) value for any bar is that bar’s price minus the 20-day SMA from 11 bars later.
Why the Moving Average Is Shifted
Shifting the moving average centers it. A normal 20-day SMA is plotted on the last day of its 20-day window, so it always trails price. Shift it 11 days to the left and it lands near the midpoint of that window, with about half the prices in the calculation before it and half after.
That’s why a centered moving average follows price more closely than a standard one. It no longer reacts only to past data. It sits among the prices it averages.
Chart example: [Insert chart: SPY with a standard 20-day SMA (dotted line) and the same 20-day SMA shifted 11 days to the left (solid line).] Both lines end at the same value, but the shifted line ends 11 bars before the last bar on the chart. Notice how the centered line tracks the price bars more tightly than the standard SMA.