Linear Regression - Indicator Formula
Updated
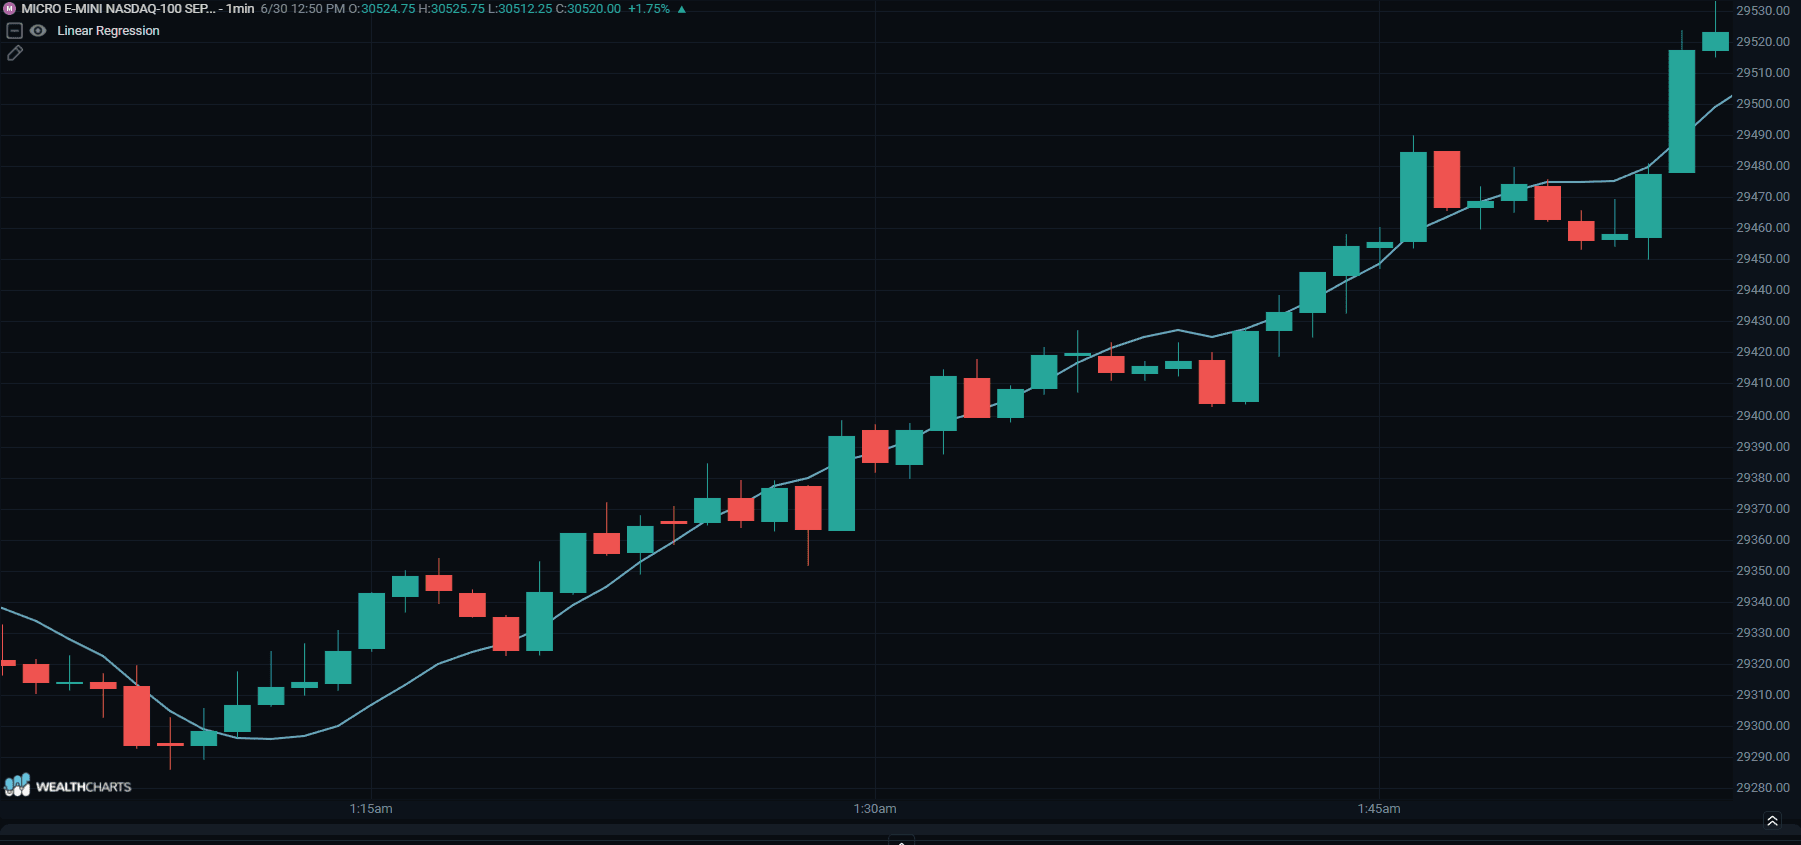
The linear regression line is the only line that minimizes the average distance between the line itself and the points of the price curve.
The regression line is therefore a segment that includes N price bars.
Let's consider an inclined segment of the curve that goes from a point L( 0 ) to a point L( n ) passing from intermediate points L( 1 ) ... L( n - 1 ), let's also imagine the point L that moves from period to period along the length L0Ln .
Let's suppose that the inclined segment is the hypotenuse of a rectangle triangle and let's call AB one of the two triangle sides.
The regression line generated from the last point L( 0 ) of the Regression Segment can be obtained with the function already known in technical analysis: LinReg( C, 7 )
and the inclination of the Regression Segment is:
LinRegSlope( C, 7 )
The Linear Regression segment can be considered as the hypotenuse of a rectangle triangle whose triangle sides are:
AB = LinRegSlope( C, N ) * ( N - 1 ) and from n = N - 1
For the Pythagorean theorem:
LOLn = SQRT( (AB)2 + (N – 1)2 ) by substituting we have:
L0Ln = SQRT( [ LinRegSlope( C, N ) * ( N - 1 ) ]2 + (N – 1)2 )
Where:
SQRT = indicates the square root
Prices moving above the Linear Regression Line are seen as positive or could begin a bullish move, while prices moving below the Linear Regression Line are seen as negative or could be beginning a bearish move.