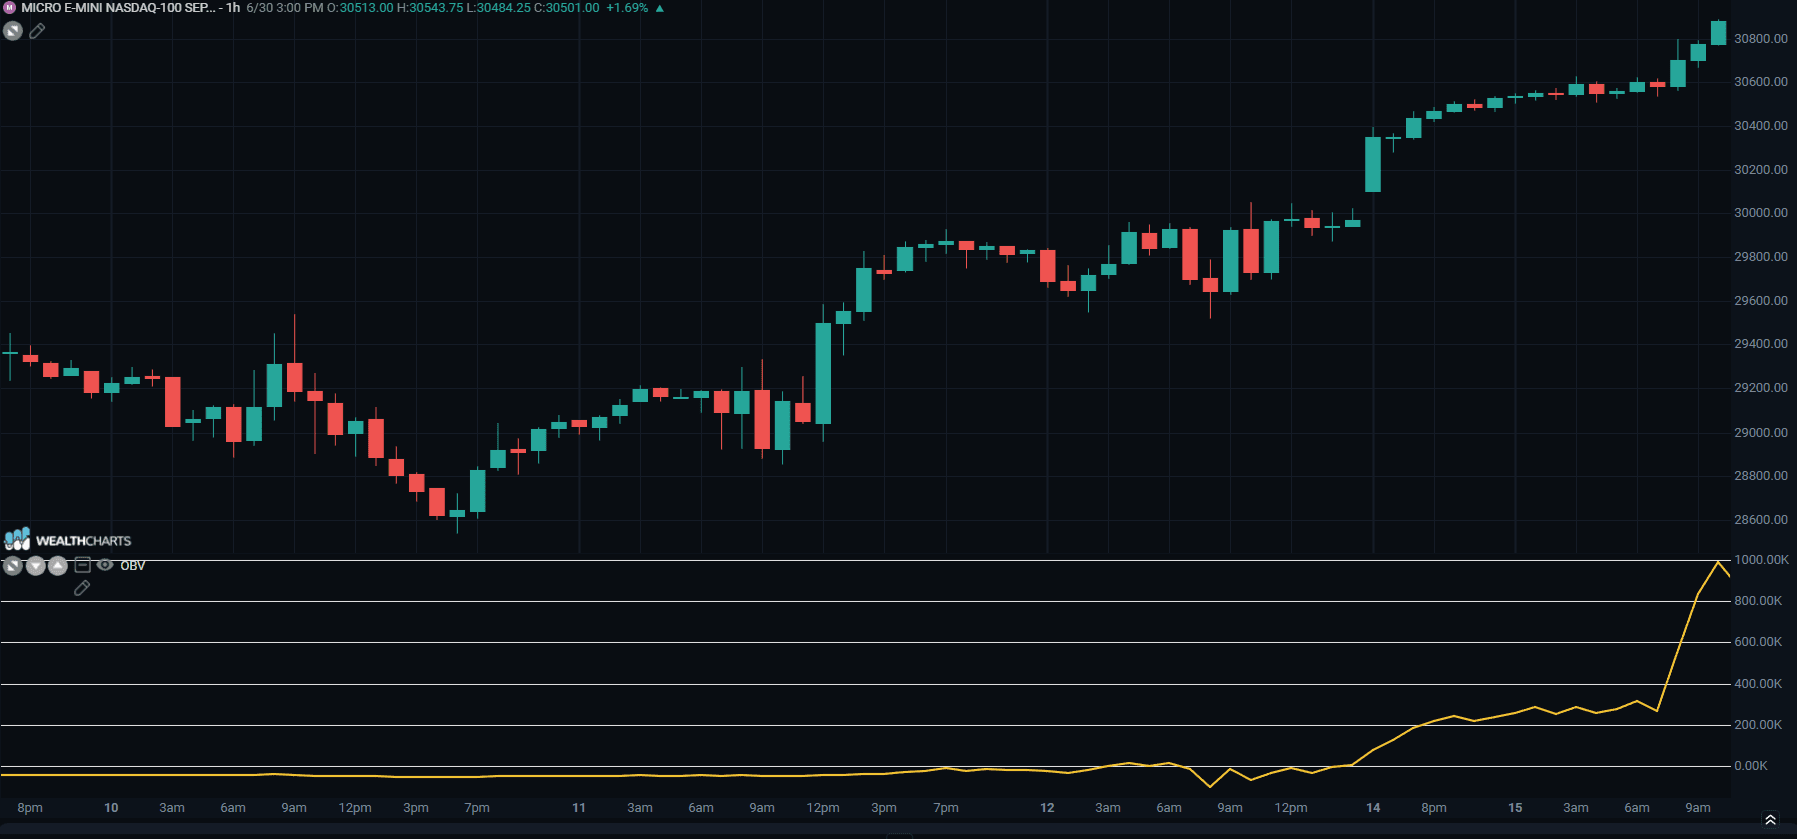
On Balance Volume (OBV) - Indicator Formula
Updated
OBV is calculated in two steps:
Initially, we take into account the total volume of each day considered to be positive or negative depending on the closing price of that session, or if the stocks closed with a higher or lower price than the previous day.
(If prices closed with a higher value, the total volume is positive; if prices closed with a lower value, the value is negative. The positive or negative value for each day is then added up to a cumulative value.)
if C( t ) < C( t - 1 ) then
OBV( t ) = OBV( t - 1 ) - V( t )
if C( t ) > C( t - 1 ) then
OBV( t ) = OBV( t - 1 ) + V( t )
where:
OBV( t ) = OBV value of the current period
OBV( t - 1 ) = OBV value of the previous period
C( t ) = closing price on the current day
C( t - 1 ) = closing price on previous day
V( t ) = stock Volume at current day
Next, plot a chart of the volumes against their positive or negative sign. From the convergence or divergence of the OBV with the price development of the underlying stock, useful indications can be drawn on the possibilities of reversing the current trend.
Particularly:
* Decreasing OBV with rising prices or a congested market, indicates an imminent decline in prices.
* Increasing OBV with falling prices, indicates an imminent reversal of the trend.
* OBV agrees with the prices, it does not provide any useful information or confirms the ongoing trend.