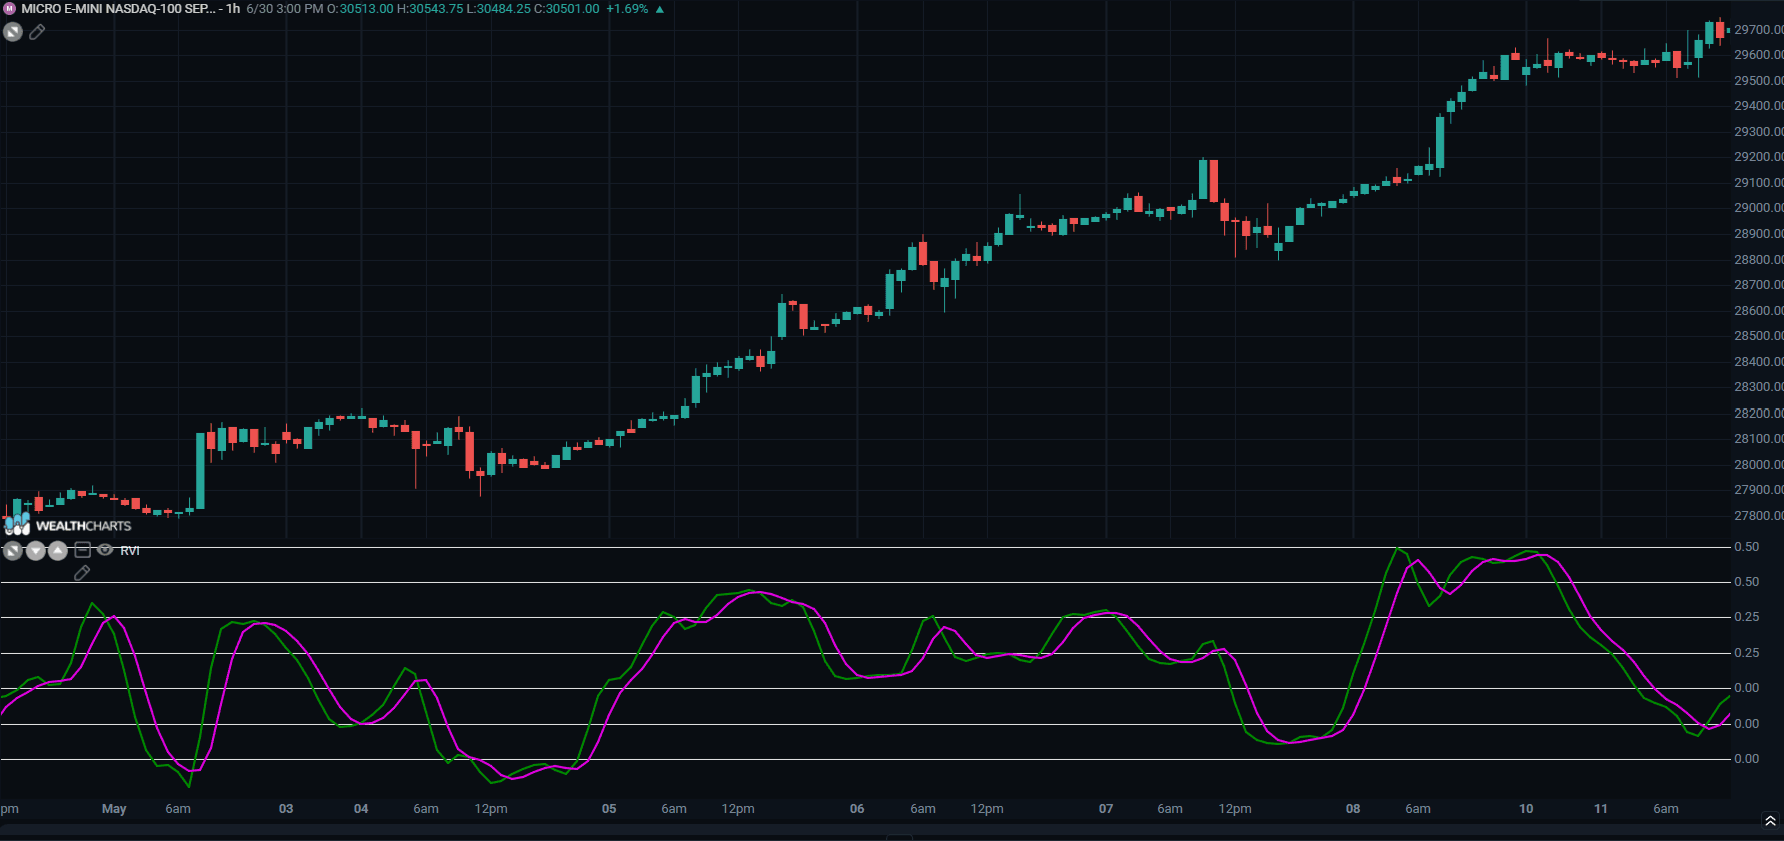
Relative Vigor Index (RVI) - Indicator Formula
Updated
Relative Vigor Index is a technical indicator that is derived similarly to the stochastics indicator but the RVI compares the close relative to the open, instead of comparing the close relative to the low.
The Relative Vigor Index is usually displayed above or below a chart. The RVI moves around a signal line rather than the market price.
When an asset’s price is above the signal line , this represents a bullish opportunity.
When an asset’s price is below the signal line, this represents a bearish opportunity.
The indications are designed to be leading indications of future price action within the market.
Calculation:
NUMERATOR = a + ( 2 * b ) + ( 2 * c ) + d / 6
DENOMINATOR = e + ( 2 * f ) + ( 2 * g ) + h /
RVI = SMA of NUMERATOR for NP periods / SMA of DENOMINATOR for NP periods
SIGNAL LINE = RVI + ( 2 * i ) + ( 2 * j ) + k / 6
Where:
a = Close - Open
b = Close - Open one bar prior to a
c = Close - Open one bar prior to b
d = Close - Open one bar prior to c
e = High - Low of bar a
f = High - Low of bar b
g = High - Low of bar c
h = High - Low of bar d
i = RVI value one bar prior
j = RVI value one bar prior to i
k = RVI value one bar prior to j
NP = number of indicator periods