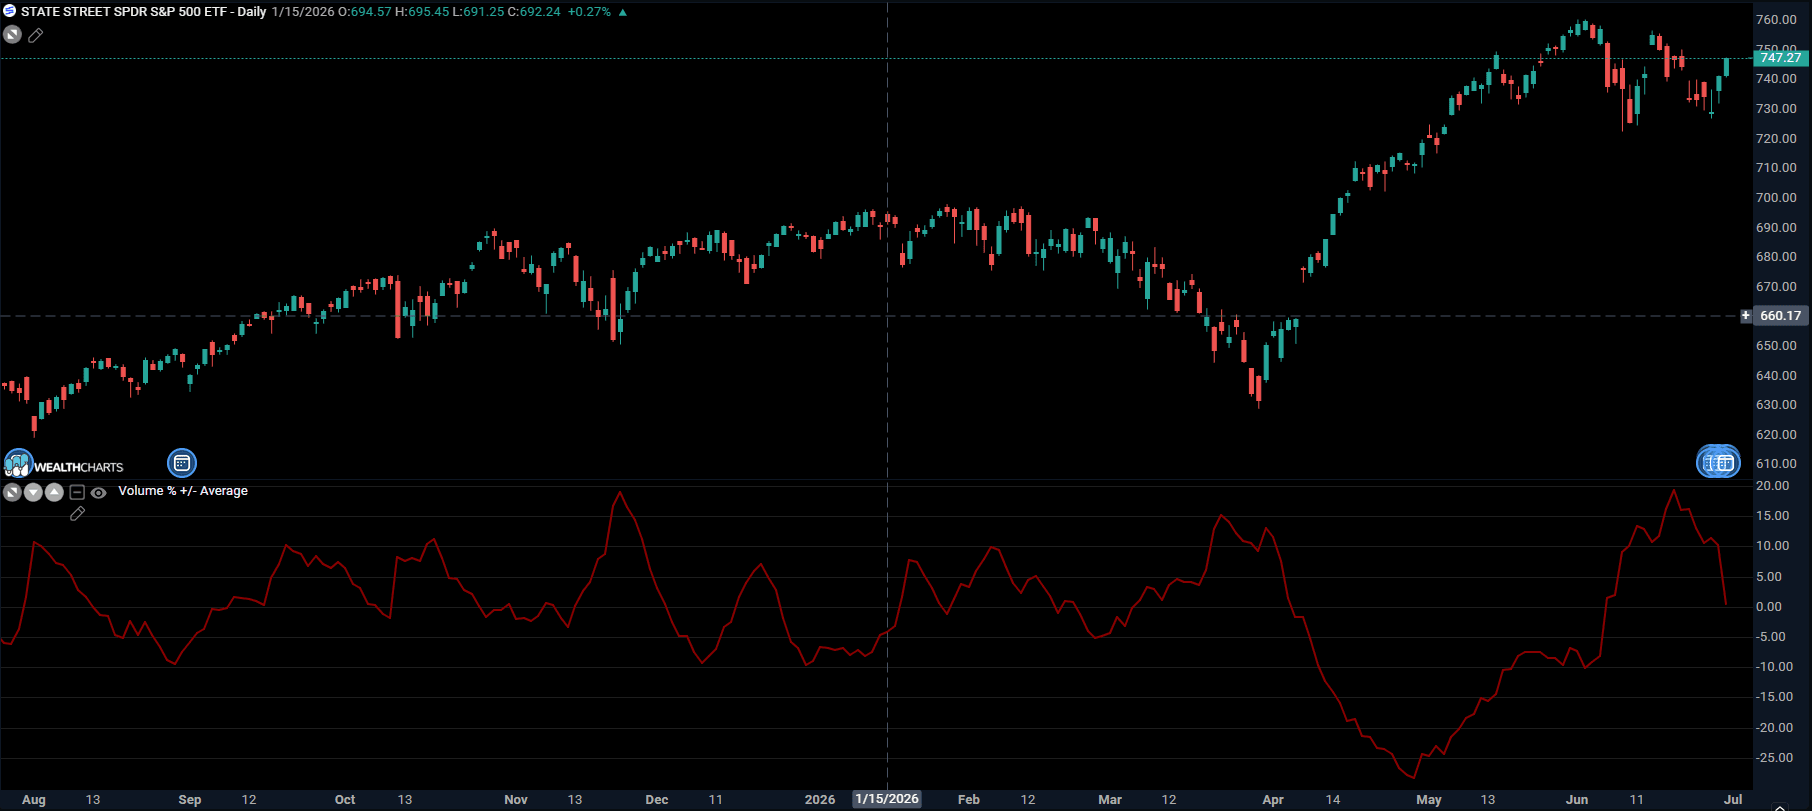
Volume % +/- Average - Indicator Formula
Updated
This is essentially the indicator that shows the cyclical pattern of volumes. In essence, it is calculated by comparing the difference between the volume and a given moving average of the volumes, to the same average.
The result will then be smoothed with a second moving average to make the output clearer. In practice, the indicator will oscillate above or below zero: in the first case, the volumes will be above their moving average by a certain percentage, in the second case they will be below their average.
It is also noticeable how the peaks of the indicator, outside the typical range of oscillation, signal with a certain reliability the reversal of the pattern of volumes first, and then of prices. The indicator then lends itself to the analysis of divergences and extremes.
When the Volume % +/- average line is above the Zero-Line, or positive, this represents an uptrend or a bullish opportunity.
When the Volume % +/- average line is below the Zero-Line, or negative, this represents a downtrend or a bearish opportunity.