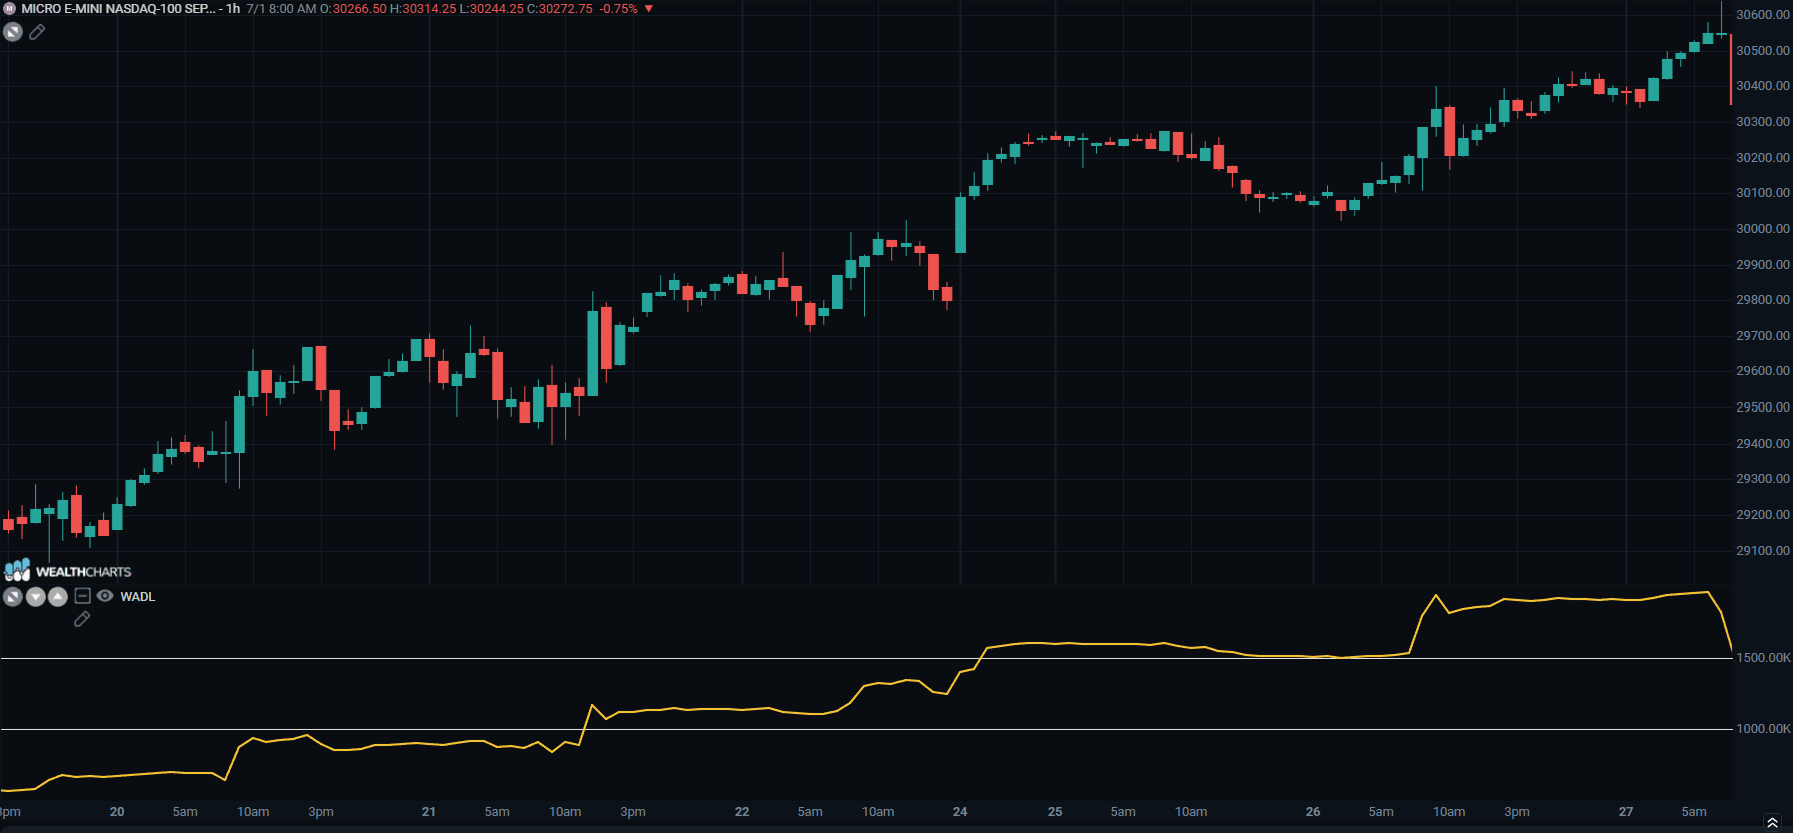
Williams Accumulation Distribution - Indicator Formula
Updated
Williams Accumulation Distribution uses divergences to help produce its signals. Distribution is taking place when the price of an asset makes a new high and the Williams A/D makes a lower high. Accumulation is taking place when the price of an asset makes and new low and the Williams A/D makes a higher low.
When there is a bullish divergence - accumulation is taking place - you go long the asset.
When there is a bearish divergence - distribution is taking place - you go short the asset.
To calculate Williams Accumulation Distribution:
Calculate the True Range High and True Range Low
True Range High ( TRH ) is the greater of:
High[ today ]
Closing price[ yesterday ]
True Range Low ( TRL ) is the lesser of:
Low[ today ]
Closing price[ yesterday ]
Compare Closing price to yesterday's Closing price
If Close[ today ] is greater than Close[ yesterday ]
Price Move[ today ] = ( Close[ today ] - TRL )
If Close[ today ] is less than Close[ yesterday ]
Price Move[ today ] = ( Close[ today ] - TRH )
If Close[ today ] equals Close[ yesterday ]
Price Move[ today ] = zero
Multiply the price move by volume
AD[ today ] = Price Move[ today ] * Volume[ today ]
Calculate the cumulative tota
Williams AD = AD[ today ] + Williams AD[ yesterday ]