Categories
Chart Features & Settings
Take your technical analysis to the next level — right from your phone!
To open the Chart Features & Settings menu, tap the Configure button on the Chart Toolbar at the bottom of your screen. From there, you will see the following options:
Candle Type: Tap this to open the Candle Type Menu, where you can switch between different candle styles for your selected chart. The available styles are Candle, Line, Heikin Ashi, and Renko!
Styling: Tap this to open the Styling Menu, where you can customize the look of your chart, including candle colors, chart background, active chart header, and much more!
Alerts: Tap this to open the Alerts Menu, where you can create a price alert for the selected chart's symbol and view any active or triggered alerts. Please note that price alerts are currently only available for LMAX Data, Equities, and ETFs.
Layouts: Tap this to open the Layouts Menu, where you can change the number of charts displayed on your screen and adjust how they are positioned!
Disconnect: Tap this to log out of your currently connected Brokerage or Prop Firm.
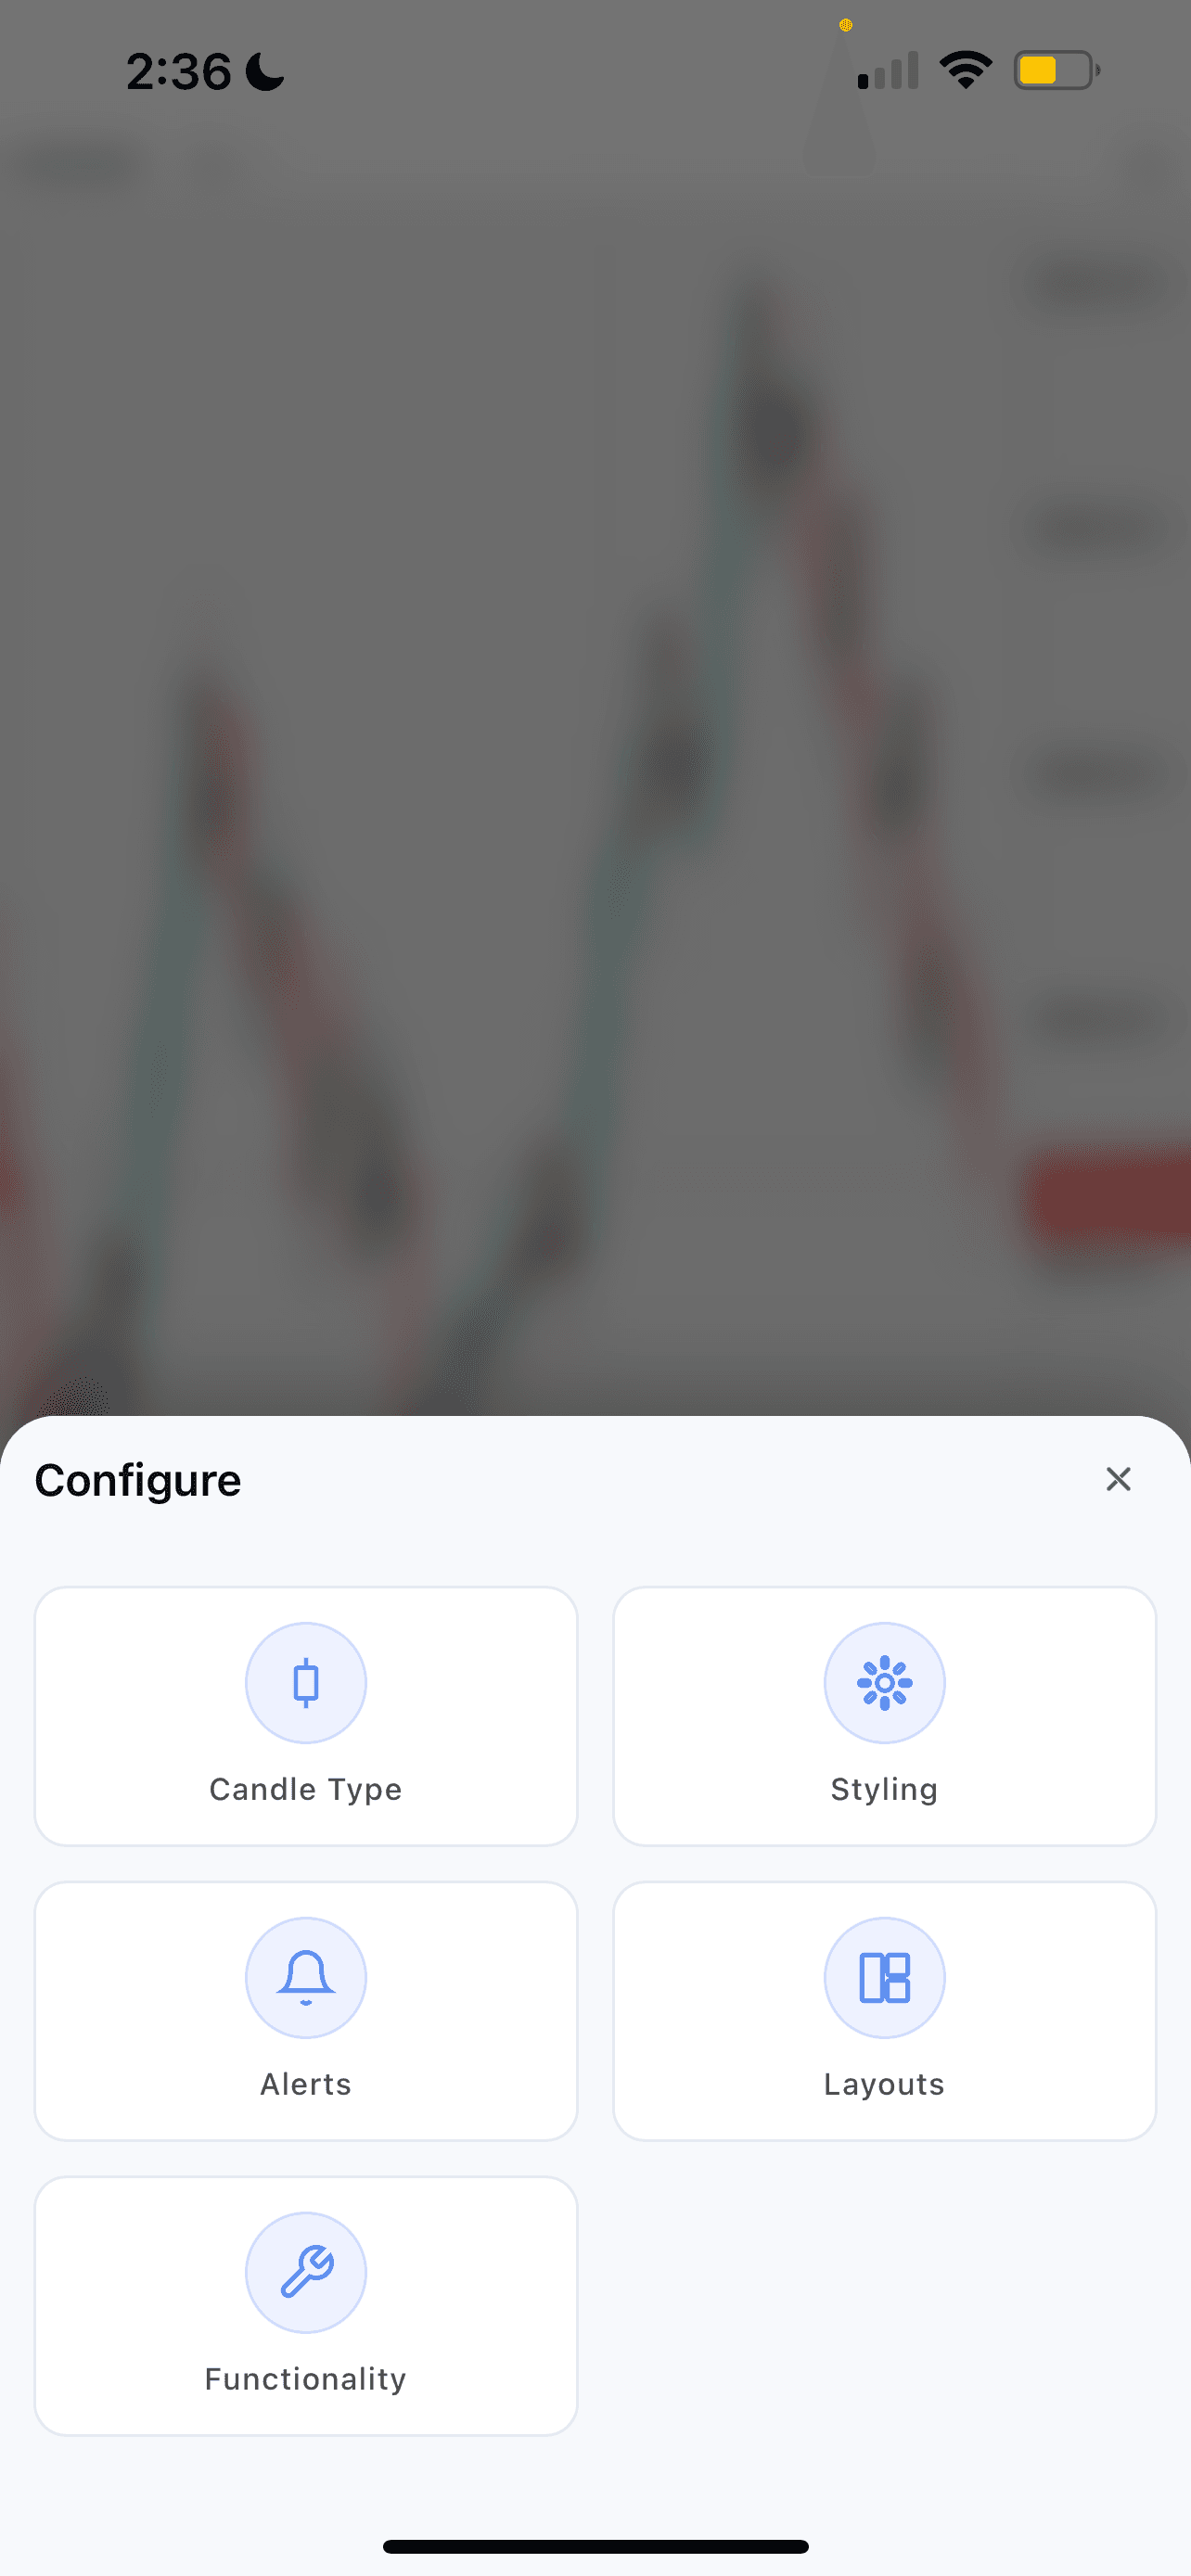
Functionality: Tap this to open the Functionality Menu, where you will find a wide range of settings you can enable or disable for your charts. There is a lot packed into this menu so be sure to explore it when you get a chance! Here are some highlights:
Display Position as Money — When enabled, your current position will be displayed as a monetary value directly on your chart.
Show Indicator Alerts — Displays messages at the top of your chart when certain indicator signals fire. Note that these alerts do not currently support sound, SMS, or push notifications.
Show Price Volume — Plots Price Volume across your chart starting from the left side.
Show Last Price Line — Displays the last recorded price of a symbol on the right side of your chart within the price axis. Also shows a countdown timer when using an hourly timeframe or lower!
Show Trade Indicators — Allows you to see and interact with trade orders and positions directly on your chart. When disabled, you will only see dashed lines and will not be able to move them.
Show Real-Time Premarket Data — Enables Real-Time Premarket Data for supported equities.
Set Font Size — Adjusts the text size across the price axis, date axis, indicator titles, and chart information displayed at the top of your screen.
Set Time Zone — Changes the timestamps displayed at the bottom of your chart. You can update your timezone at any time!
