Categories
Charts Page
Advanced Charts, Real-Time Data, Smarter Trades!
To get to the Charts Page, simply tap the Chart button located at the bottom center of your screen. Let's cover the page from top to bottom!
Please note: Your currently selected chart is indicated by a blue header at the top. This header color can be customized within the Styling configuration of the chart.
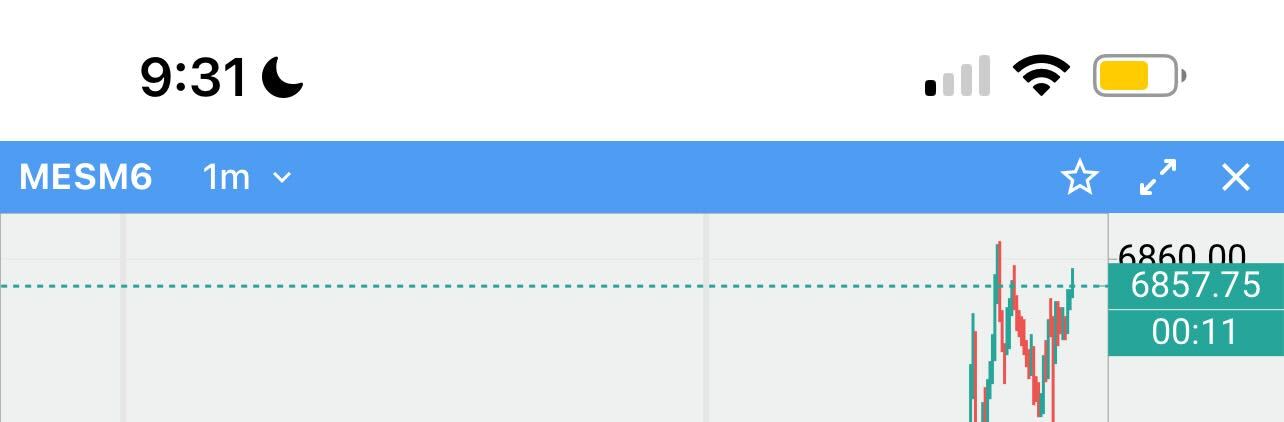
Chart Header:
At the top of your selected chart, you will find the following:
Symbol — Displays the symbol your chart is currently showing data for. Tap it to search for and switch to a different symbol.
Timeframe — Displays the current timeframe your chart is set to. Tap it to change it.
Star — Opens your Favorite Toolbar, which displays all of your favorited tools and gives you the ability to post a WealthThought for the selected chart.
Arrows — Allows you to expand or shrink your selected chart. This will only appear when you have multiple charts on your layout.
X — Closes the selected chart. This will only appear when you have multiple charts on your layout.
General Functionality:
Here is a breakdown of the gestures and controls available on the Charts Page:
Long Press — Press and hold on the chart to quickly place a limit or stop order at your desired price level.
Double Tap — Brings up the Crosshair and Data Window. Once the Crosshair is enabled, tap the button that appears in the top left corner of your chart to expand the Data Window for more detail.
Price Scale — Drag the Price Scale up or down to adjust the vertical compression of the candles on your chart.
Return to Current Candle — When browsing historical data, tap the arrow that appears on the chart's Price Scale to instantly jump back to the current forming candle.
Zoom In/Out — Pinch the chart with two fingers to zoom in or out on any area of the chart!
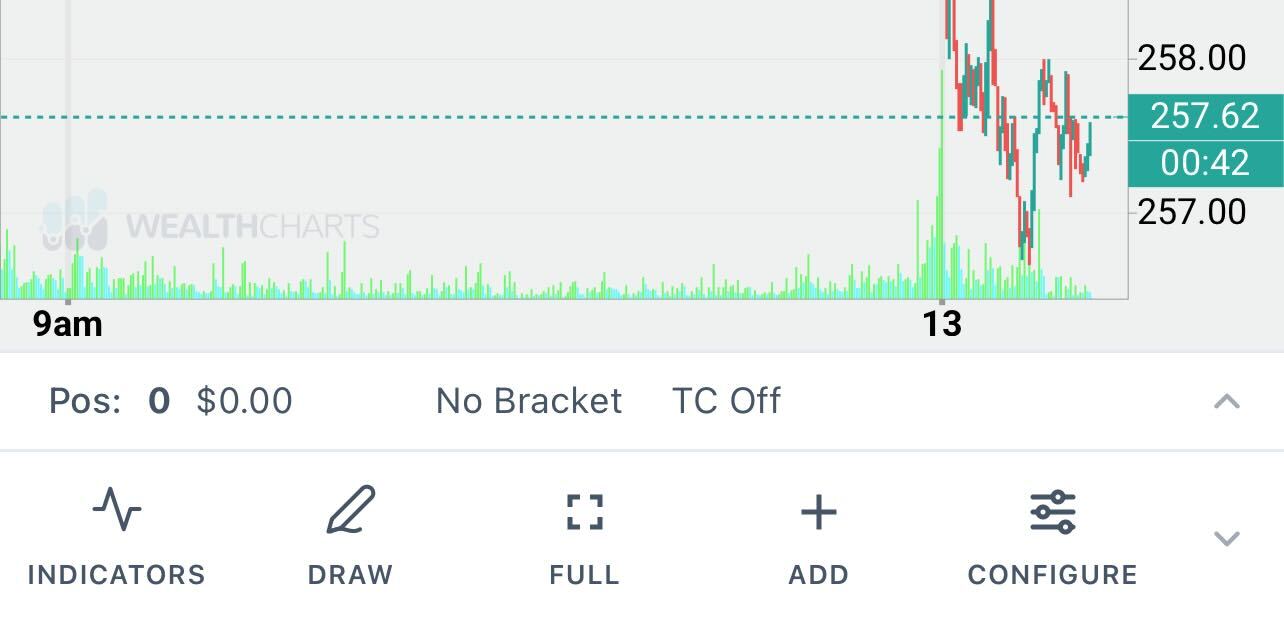
Chart Toolbar:
Located at the bottom of your screen just above the Navigation Bar, the Chart Toolbar gives you quick access to everything you need to manage your charts. Here is a breakdown of each option:
Indicators — Tap this to browse and apply any of the many indicators that WealthCharts has to offer to your selected chart.
Drawing Tools — Tap this to access all available drawing tools and mark up your chart with your own analysis.
Full Screen — Tap this to expand your Charts Page to full screen for a bigger, cleaner view of your chart.
Add — Tap this to add another chart to your layout. You can have a maximum of 4 charts on your screen at one time!
Configure — Tap this to explore your chart's full configuration and settings.