Categories
Trading Simulator
Practice buying and selling shares of your favorite stocks and using those indicators while you are pressed for time just like in the real world! You can set up your custom simulation or throw yourself to the wolves by setting up a random scenario.
To find the Trading Simulator in WealthCharts, follow the instructions below:
- Go to the Main Menu located at the top left corner of the platform.
- Go to the Trading category
- Select Simulator and load it up on to your screen.
- You will be met with two options: Analysis and Practice
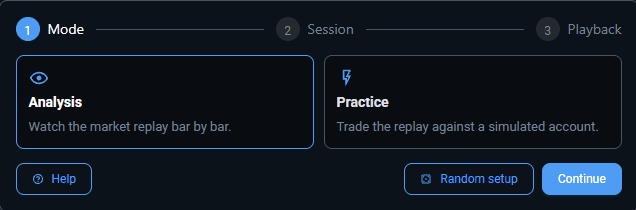
For more info about what each mode does, be sure to click on the 'Help' button!
Once you choose between Analysis and Practice, you can click 'Random setup', to have all your settings randomized, or you can click 'Continue' to modify the settings yourself.
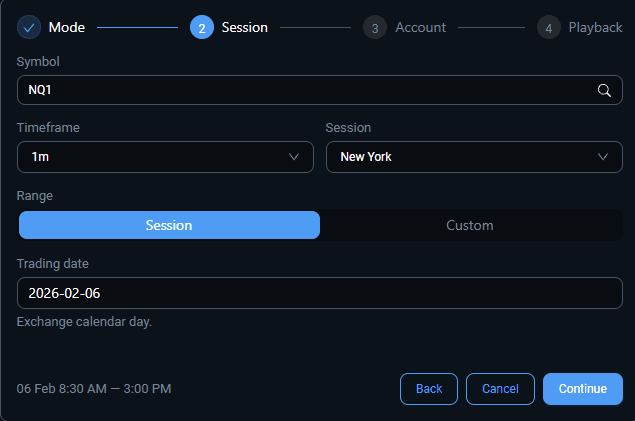
The Session tab is where you will choose your Symbol, Timeframe, Session, and Range. You can set the Range to be for an entire date of your choosing, or set a custom range. For example, October 1st, 2026 9:00am-12:00pm, or you can choose the tail of the data such as the last 30 minutes, 1 hour, 3 hours, etc.
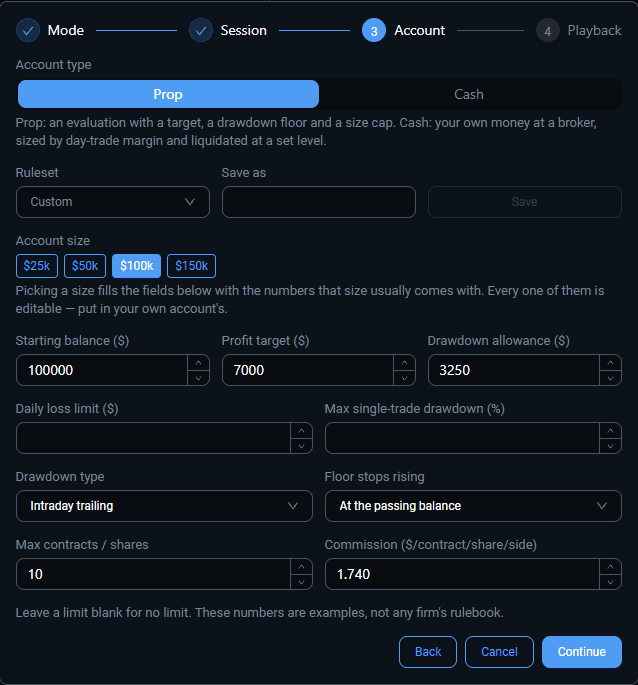
The Account tab is the next set of options you can modify. The first option is to choose between Prop or Cash.
- Prop: An evaluation with a target, a drawdown floor and a size cap.
- Cash: Your own money at a broker sized by day-trade margin and liquidated at a set level
You will then select a Ruleset. You can save your Ruleset for later use by setting the options to your liking, and then clicking on the 'Save' button. Be sure to give the Ruleset a unique name.
Next you will choose Account size, Starting Balance, Profit Target, Drawdown Allowance, Daily Loss Limit, Max single-trade drawdown percentage, Drawdown type, Floor stops rising, Max contracts/shares, and Commission.
When you choose your account size, the Starting balance, Profit Target, Drawdown Allowance, and Max contracts/shares will be adjusted accordingly. These fields can be edited as well if you do not want to use one of the preset options. You can leave a limit field blank for no limit.
The Drawdown Types are as follows:
- Intraday Trailing: A risk management rule where the minimum allowed account value (the liquidation floor) rises in real-time based on your highest peak equity, tracking both closed profits and open, unrealized trade profits.
- End of Day Trailing: A risk management rule where the minimum allowed account value rises only at the daily market close, calculated using your settled account balance and completely ignoring any mid-day profit spikes.
- Static Drawdown: A risk management rule where the minimum allowed account value is a fixed dollar amount calculated from your initial starting balance that never moves or trails upward, regardless of how much profit you make.
The Floor Stops Rising:
- At The Passing Balance: Once your account balance reaches its initial starting amount (or the profit target to pass), the trailing drawdown floor locks in place and stops moving upward.
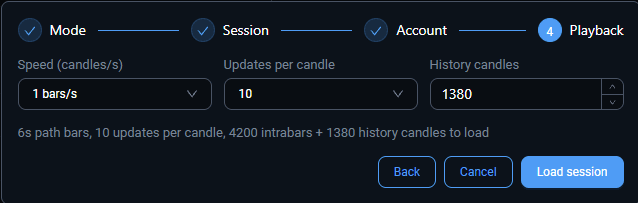
The Playback tab lets you choose the Speed, Updates per Candle, and History Candles
- Speed: The number of candles per second
- Updates per Candle: How many times a single candlestick refreshes its price movement before it officially closes
- History Candles: The archived data blocks used to build the charts from past market sessions.
Once you load your session, the symbol and chart will appear on your screen and will look very similar to a standard chart in the platform. You will have a bar along the bottom with options to control or modify the simulator. An image of that bar is provided below.

- The play and pause button allows you to start and stop the simulator.
- The speed option allows you to adjust the number of candles per second.
- The Account tab displays the Balance, Max Balance, Liquidates At, Room Left, Distance to Target, Costs, Drawdown Remaining and Progress to Target
- The Trades tab will show all of the trades you have made during this simulated session.
- Allows you to jump to London Close.
- Allows you to jump to the end of the session.
- The session settings allows you to modify the settings that you chose before the simulated session began, such as Session, Account, and Playback.
- The Simulator settings allows you to adjust where the settings menu docks to (top or bottom of the chart) and adjust the font size of the bar on the bottom.
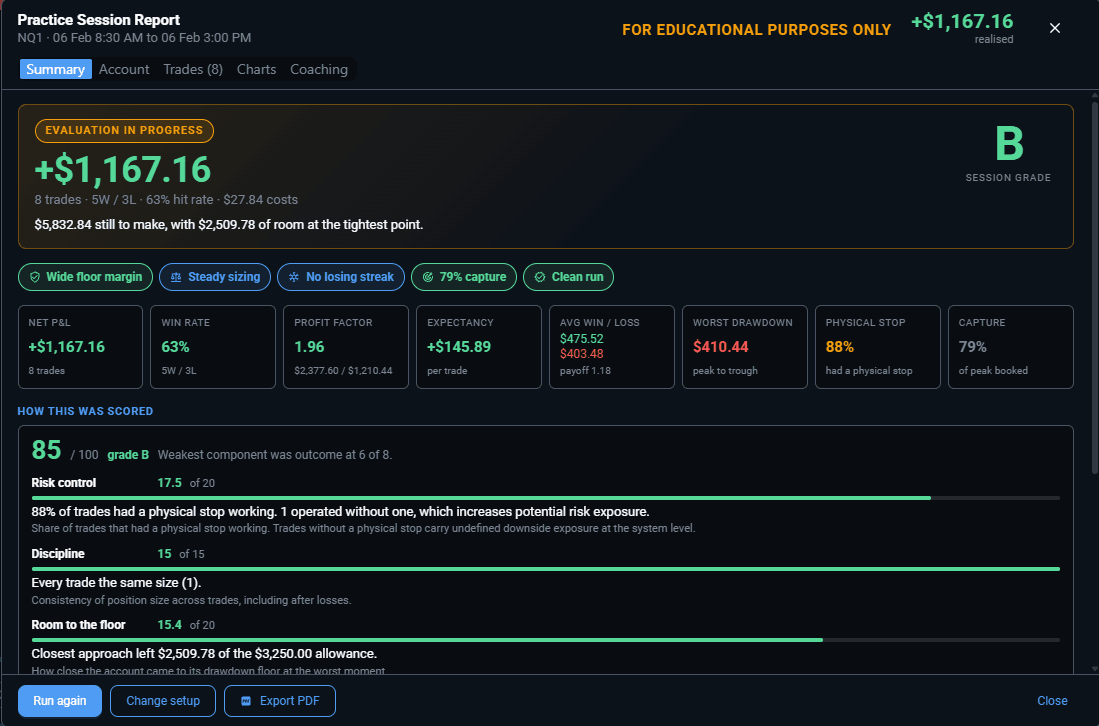
- The Session Report tells you your stats for the simulated session, such as, Net P&L, Win Rate, Profit Factor, Expectancy, Avg Win/Loss, Worst Drawdown, etc.
- The Pop-out button allows you to pop out the Account/Trades tab window to let you move this window where you would like on your screen.
- This button collapses the bottom panel to be more condensed.
Once you have completed your simulated session, your session report will appear on your screen with the stats from the session. From here you can choose to 'Run Again' which will restart your session with the same settings, 'Change Setup' which allows you to change the settings for the simulator, or 'Export to PDF' which will export your session result to a PDF.