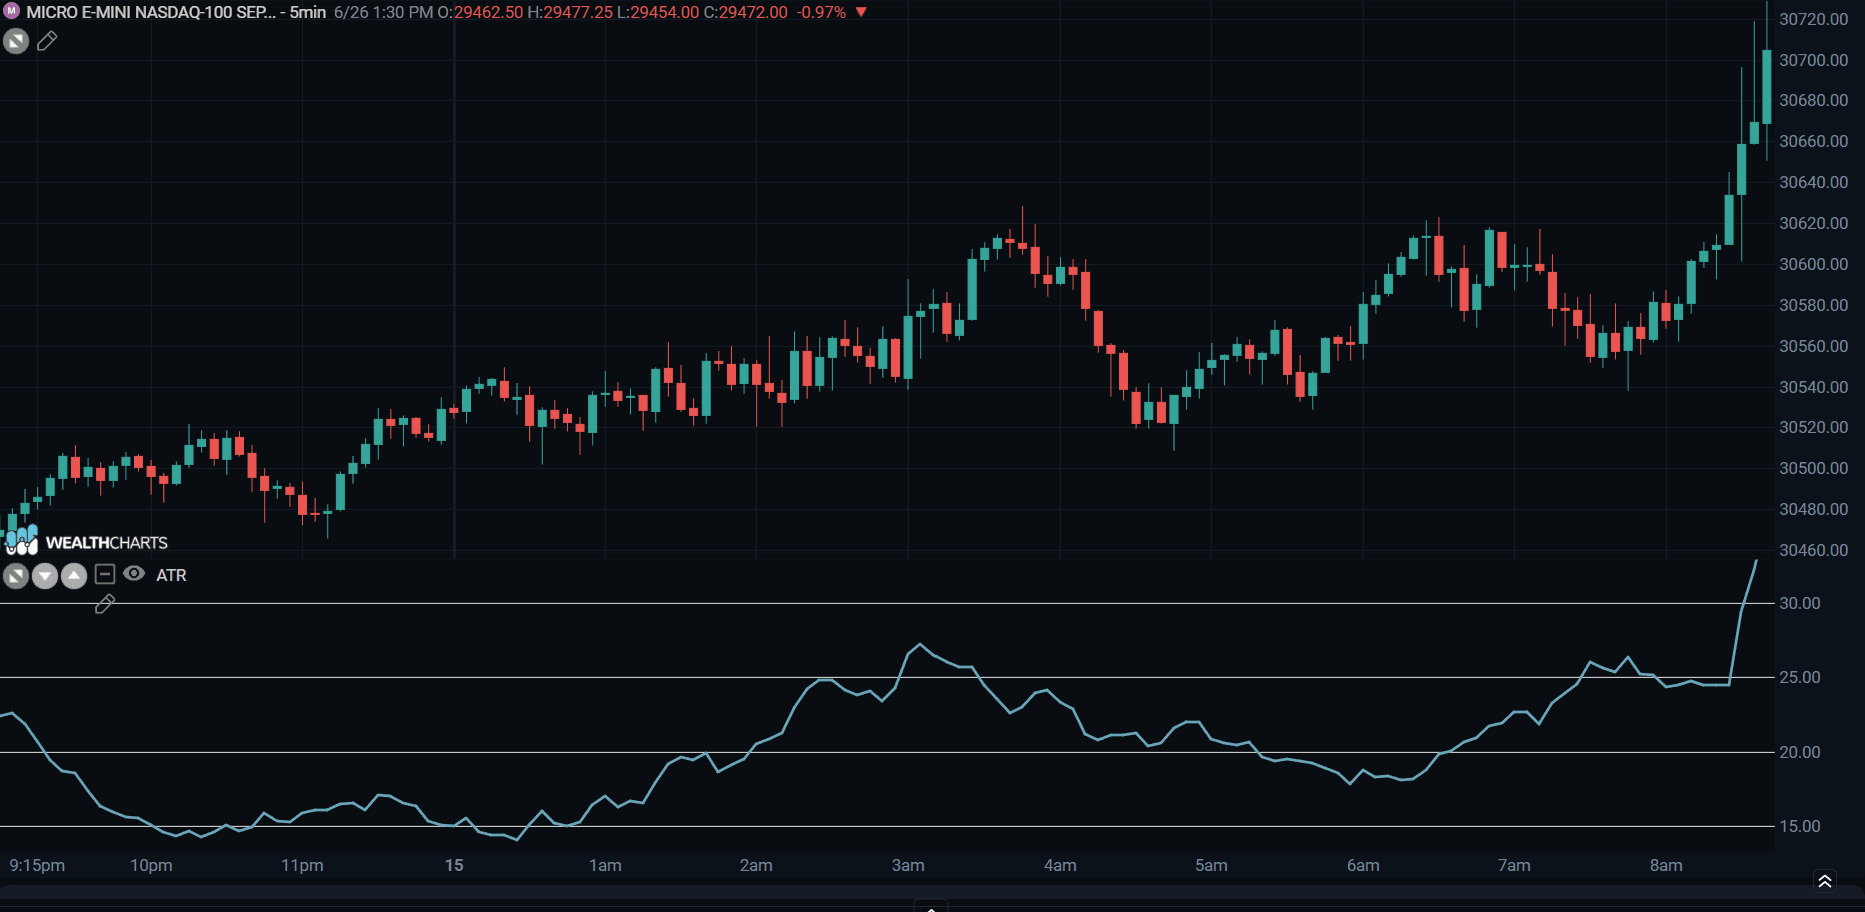
Average True Range (ATR) - Indicator Formula
Updated
The True Range is the maximum movement recorded by the price on the current day or, alternatively, the comparison between the end of the previous day and the extreme reached on the current day.
In actual terms, the True Range is the larger of the two:
The distance between today's maximum and minimum;
The distance between yesterday's closure and today's maximum;
The distance between yesterday's closure and today's minimum;
Hence the formula:
TR( t ) = the maximum between
H( t ) - L( t )
ABS( C( t - 1 ) - H( t ) )
ABS( C( t - 1 ) - L( t ) )
where:
TR( t ) = True Range of the current day;
H( t ) = Maximum of the current day;
L( t ) = Minimum of the current day;
C( t - 1 ) = Closing of the previous day;
ABS( ) = Function that returns the absolute value;
But the True Range as such, is a number with little meaning.
To make it useful, you need to consider its past performance, calculating a simple moving average.
ATR( ) = simple moving average of TR( ) to NP.
where:
ATR( ) = Average True Range;
NP = Number of periods for the calculation of the indicator;
If ATR is increasing there are higher potential levels of volatility.
If ATR is decreasing there are lower potential levels of volatility.