Awesome Oscillator (AO) - Indicator Formula
Updated
The Awesome Oscillator (AO) was developed by a gentleman named Bill Williams. The oscillator is used to measure the momentum within a particular asset. The AO is calculated by subtracting the 34 period Simple Moving Average from the 5 period Simple Moving Average. The SMA's are calculates using the moving averages midpoints instead of closing prices.
The Awesome Oscillator is calculated as follows:
lenAO1 = input( 5, minval=1 ) //5 periods
lenAO2 = input( 34, minval=1 ) //34 periods
AO = SMA( High + Low / 2, lenAO1 ) - SMA ( High + Low / 2, lenAO2 )
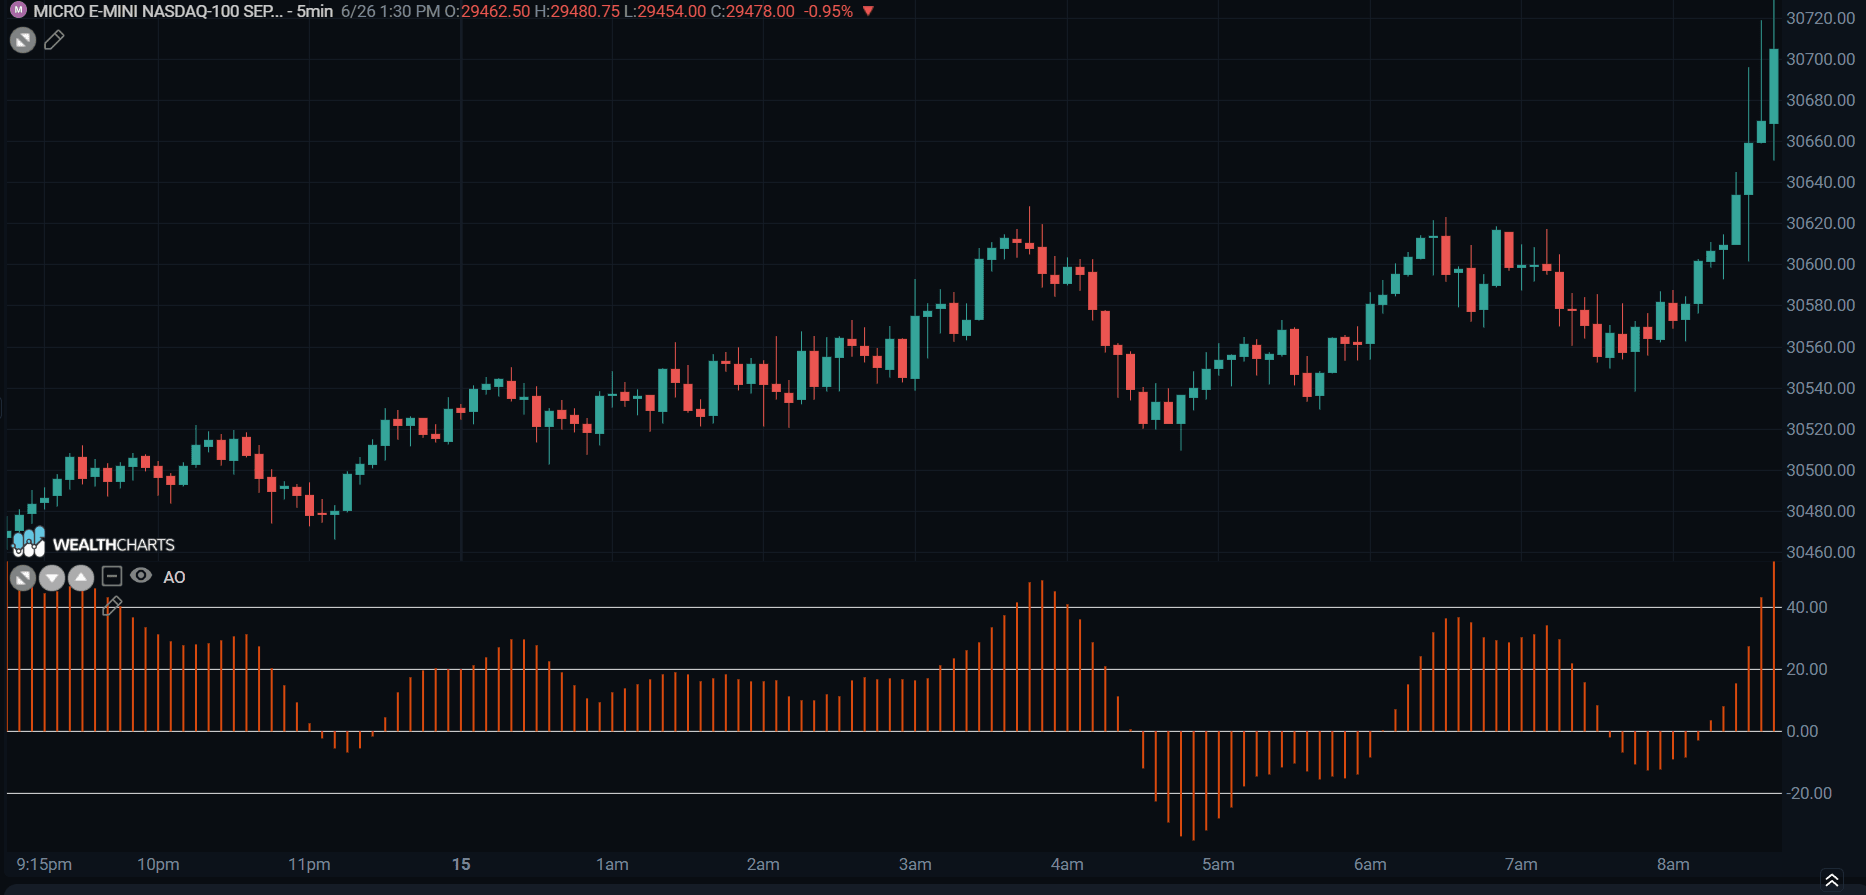
The AO's derived values fluctuate above and below a Zero-Line and are plotted on a histogram with red and green bars.
When AO is above the Zero-Line, this represents a bullish opportunity. It shows a shift in short term momentum, which is now rising faster than the long term momentum.
When AO is below the Zero-Line, this represents a bearish opportunity. It shows a shift in short term momentum, which is now falling faster than the long term momentum.