Categories
Chart Replay
Chart Replay is a feature located within your charts that you can drag back to any point and replay the bars. This way, you can test what signals you believe are going to fire off as the replay happens.
To get started, right-click your chart anywhere. Refer to the bottom of the Right-Click Menu and click the button that says Start Chart Replay. You will see a blue vertical line appear as you move your cursor around your chart. Left-click where you want the replay to begin, and the chart will change.
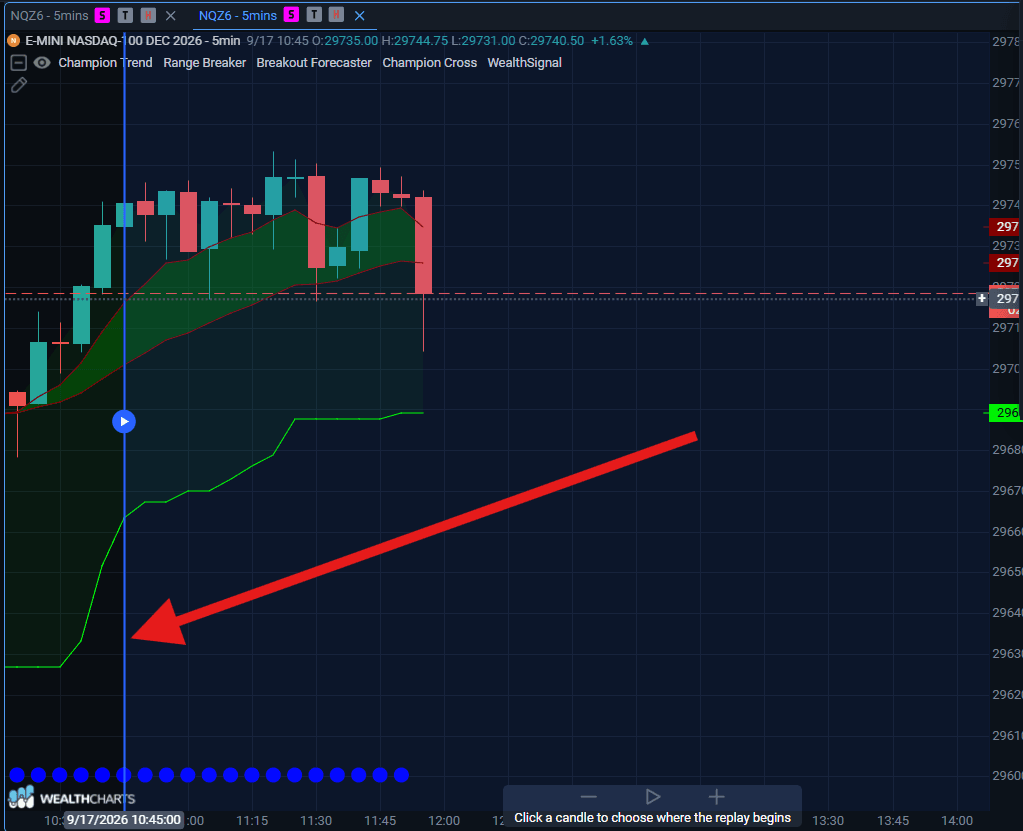
After that, you will see a play bar appear towards the bottom of your chart. That is where you can play, pause, slow down, or speed up the replay!
To exit the replay, right-click your chart again and then select "Stop Chart Replay".