Categories
Changing Timeframes
At WealthCharts, we make it easy for members to change their timeframes. As of right now, there are four different ways to change your timeframe on your charts!
Top Bar: Towards the top left corner of your chart, to the right of your current symbol, you will see a few timeframes. You can select any of these to use on your chart. On the right side of this list, there is a down-facing arrow. Clicking this arrow will display even more timeframes to choose from.
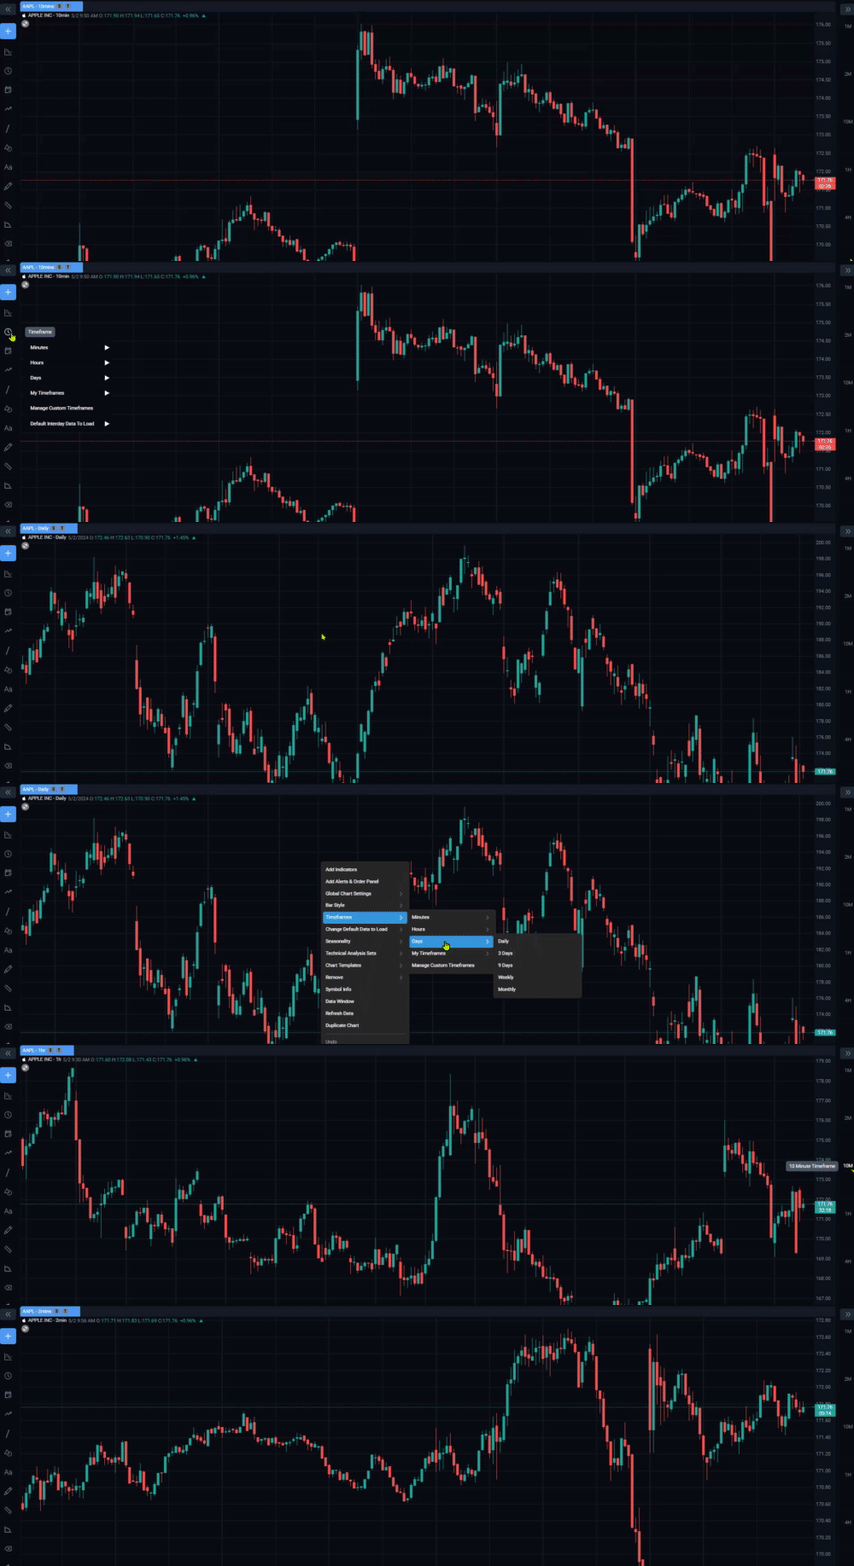
Right-click Menu: Right-click any of your charts and look in the upper third of the menu. You will see a timeframes button. Hover over the button and you will see Seconds, Minutes, Hours, and Days. Hover over any of those sub-categories and you will see the pre-built timeframes you can change your chart to.
Favorites Toolbar: Got a set of timeframes you want to quickly reference to change any of your charts? Head over to the favorites bar on the right side of your platform. Click on the Customize Favorites Bar button (sliders icon). Select to add any of the timeframes you want to your favorites bar for quick access.
Chart Toolbar: You will see a Timeframes button (clock icon) on the far left side of your screen. Clicking on that button will display Seconds, Minutes, Hours, and Days. Hover any of those sub-categories and you will see the pre-built timeframes you can change your chart to. If you don't see a the Timeframes button, navigate to the Customize Toolbar button (sliders icon) on the top of the left-hand toolbar. Turn on Timeframe in the OTHER section, ensuring the push pin lights up blue.
Pro Tip: Don't see a timeframe you want to use on your chart? Check out the related articles below to see how to make your own custom timeframe!