Categories
Symbol Info
The Symbol Info window offers a comprehensive set of analysis tools for any given symbol – here you can learn more about both technical and fundamental factors that are currently at play for this stock.
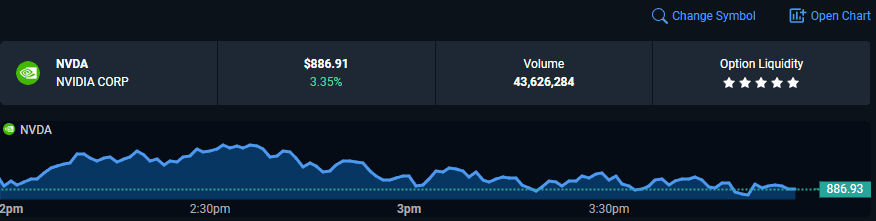
A heads-up display is available for a quick snapshot of the current price, volume, and option liquidity of the stock being analyzed. Here, you will also find a “Change Symbol” button that allows you to switch to a different symbol and a handy shortcut to a full-out chart of the stock.
The analytical segment of the Symbol Info is split into four tabs – Technicals, which will offer data about chart-based signals and trend, Fundamentals, with financial performance stats such as dividends and earnings, Research, covering miscellaneous research tools such as insider trading data, and the News tab with data about any important new events about the stock.

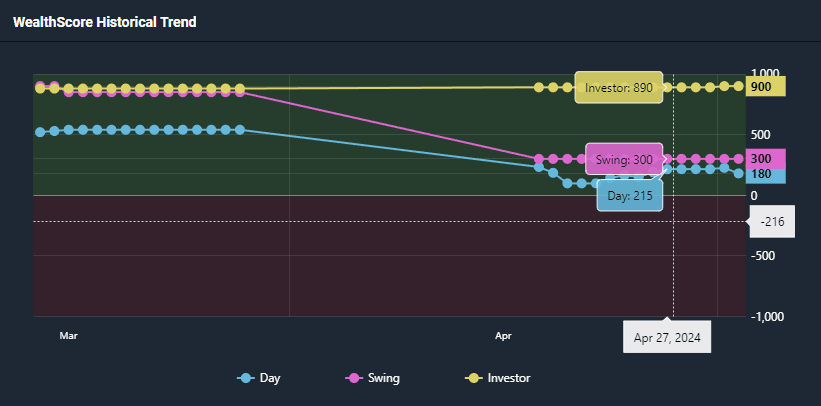
The Technicals tab offers:
- A breakdown of the historical Wealthscanner scores for the stocks, available for multiple timeframes. This gives you important perspective on how the Wealthscores have been changing over time.
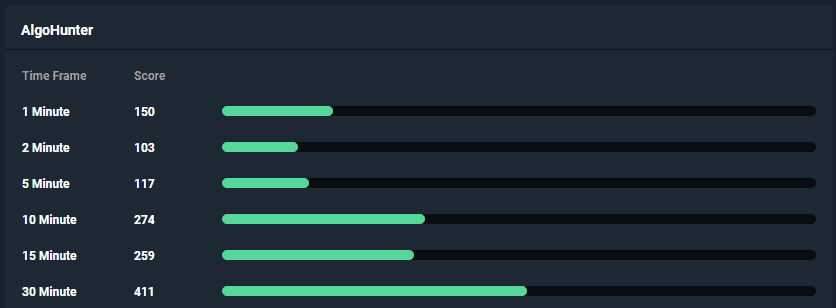
- A complete AlgoHunter score breakdown for all of the available timeframes, offering a clear picture of various technical signals in play for this stock currently.
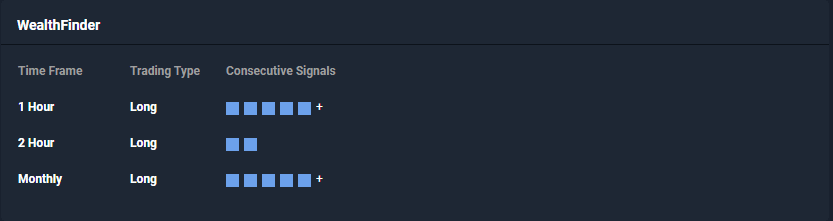
- Any signals currently firing off in the WealthFinder tool.
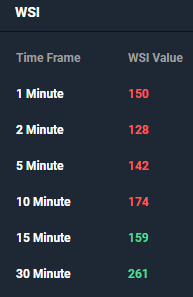
- A breakdown of WSI scores across multiple timeframes, which will give you a clear idea of the technical trend strength and direction.
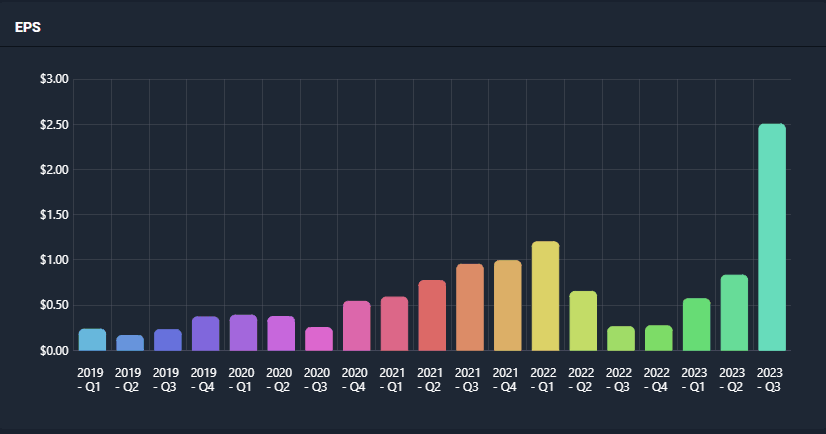
The Fundamentals tab is all about financial data, mostly presented in a quarterly format. Here are some of the items available here:
- A quarterly earnings data breakdown:
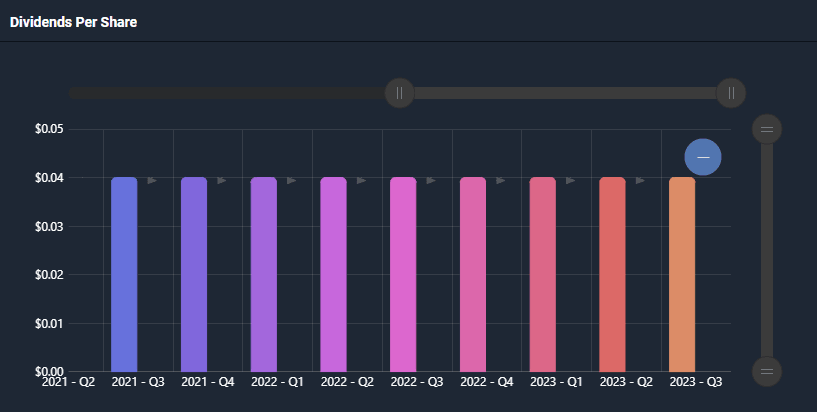
- A quarterly breakdown of data on Dividends and Revenue Growth
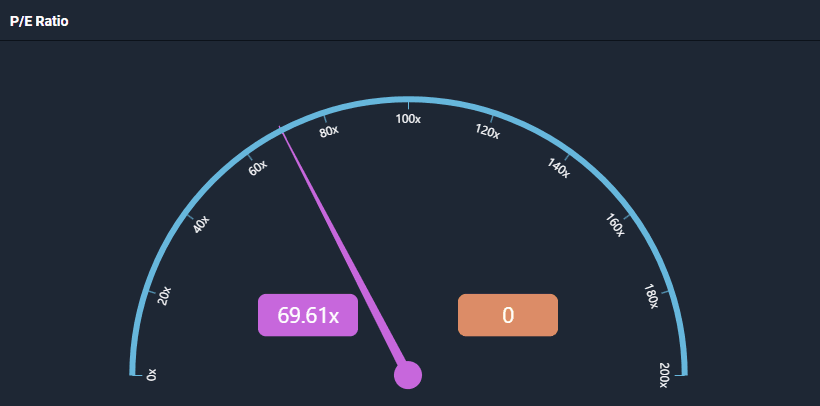
- A P/E Ratio meter
The Research tab is home to data from some of the more advanced WealthCharts research tools. This includes:
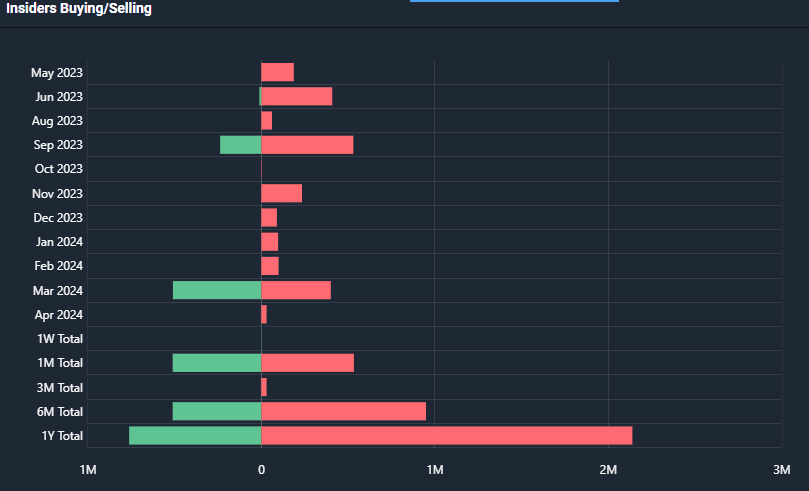
- A breakdown of insider buying and selling. This is offered in a very convenient format that includes aggregations for different time periods and month-by-month data. The visualization of the graph helps compare insider selling to insider buying within any given period too.
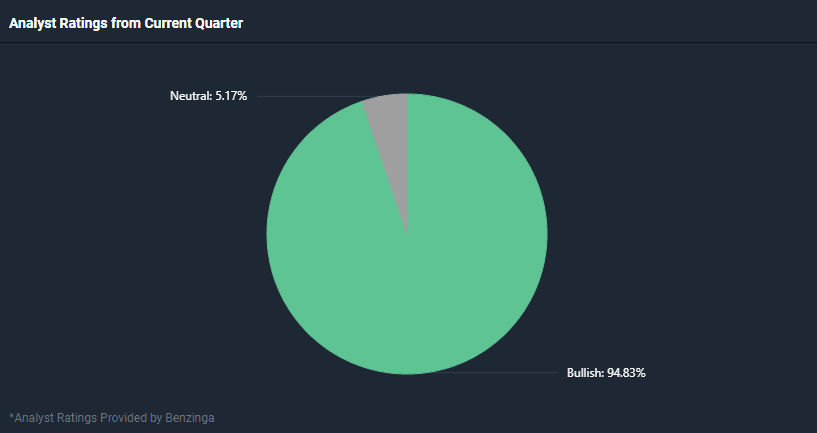
- A breakdown of analyst ratings for the current quarter, in a convenient visual format
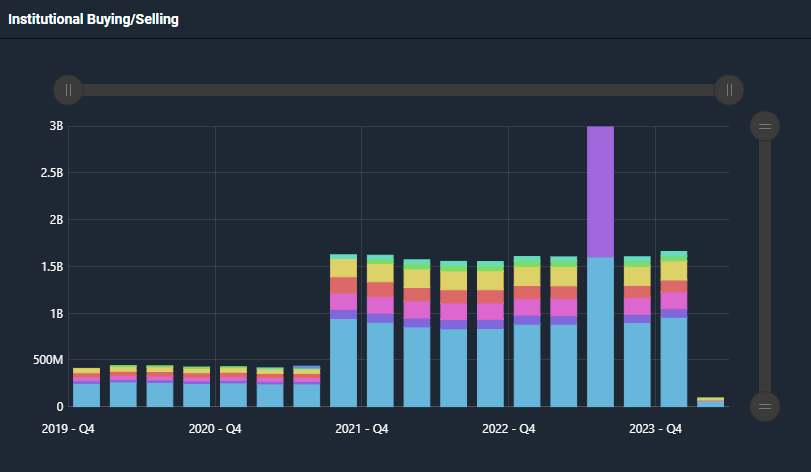
- Quarterly data for institutional buying and selling, as well as guidance numbers.
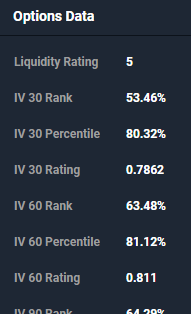
- Detailed options data with Implied Volatility percentiles, ranks and ratings.
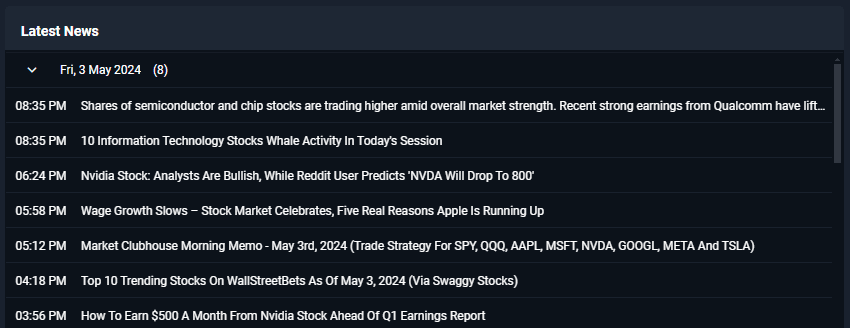
The News tab has a single, but important component – a chronological track record of any news reported recently that are related to the stock being analyzed: