Seasonality Tools from WealthCharts
Back to school shopping, Black Friday sales...
…stocking up on candy for Halloween - these are all examples of annual consumer buying trends that we are all aware of, but they represent just a small fraction of the seasonal data that is actually out there that WealthCharts members get access to
WealthCharts automates Seasonal analysis!
In addition to reviewing up to 20 years of historical data to identify recurring trends, WealthCharts' Seasonality Scanner pairs that data-driven approach with our proprietary algorithms and enhanced charts, we uncover recurring trends and seasonality patterns that give you the edge in your investment decisions. See the market in a whole new way—data-driven, intuitive, and actionable!
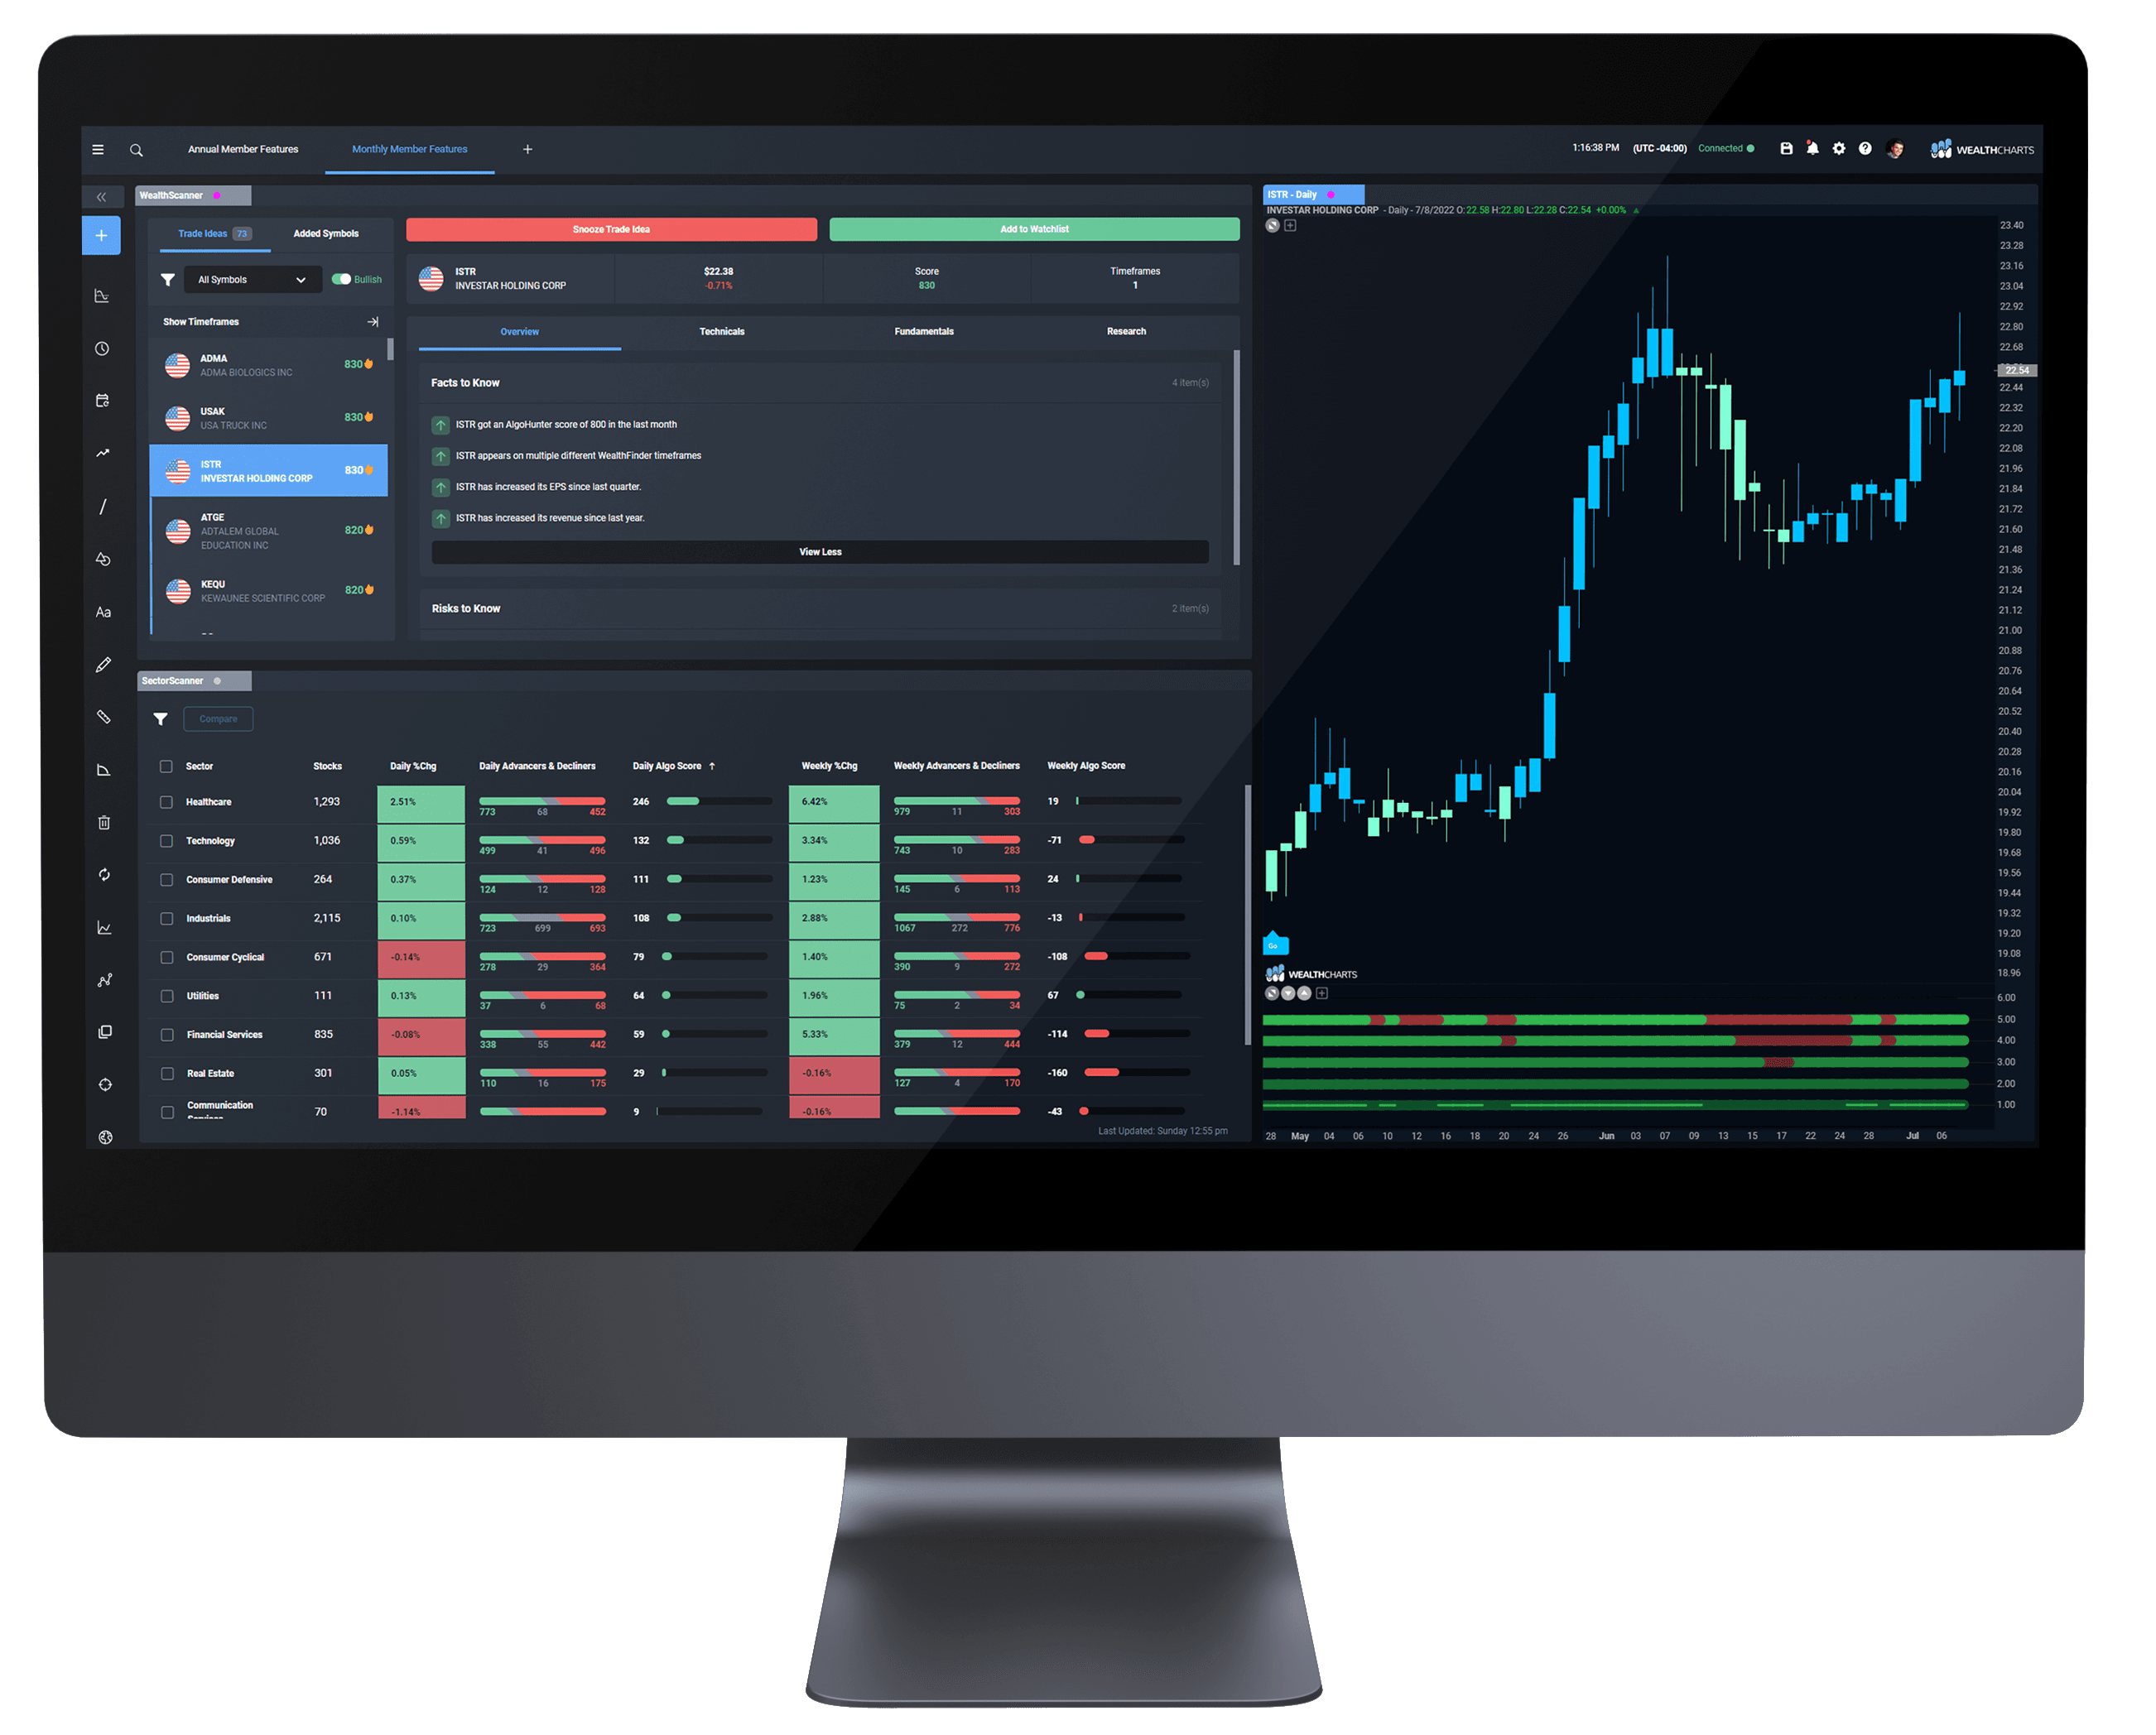
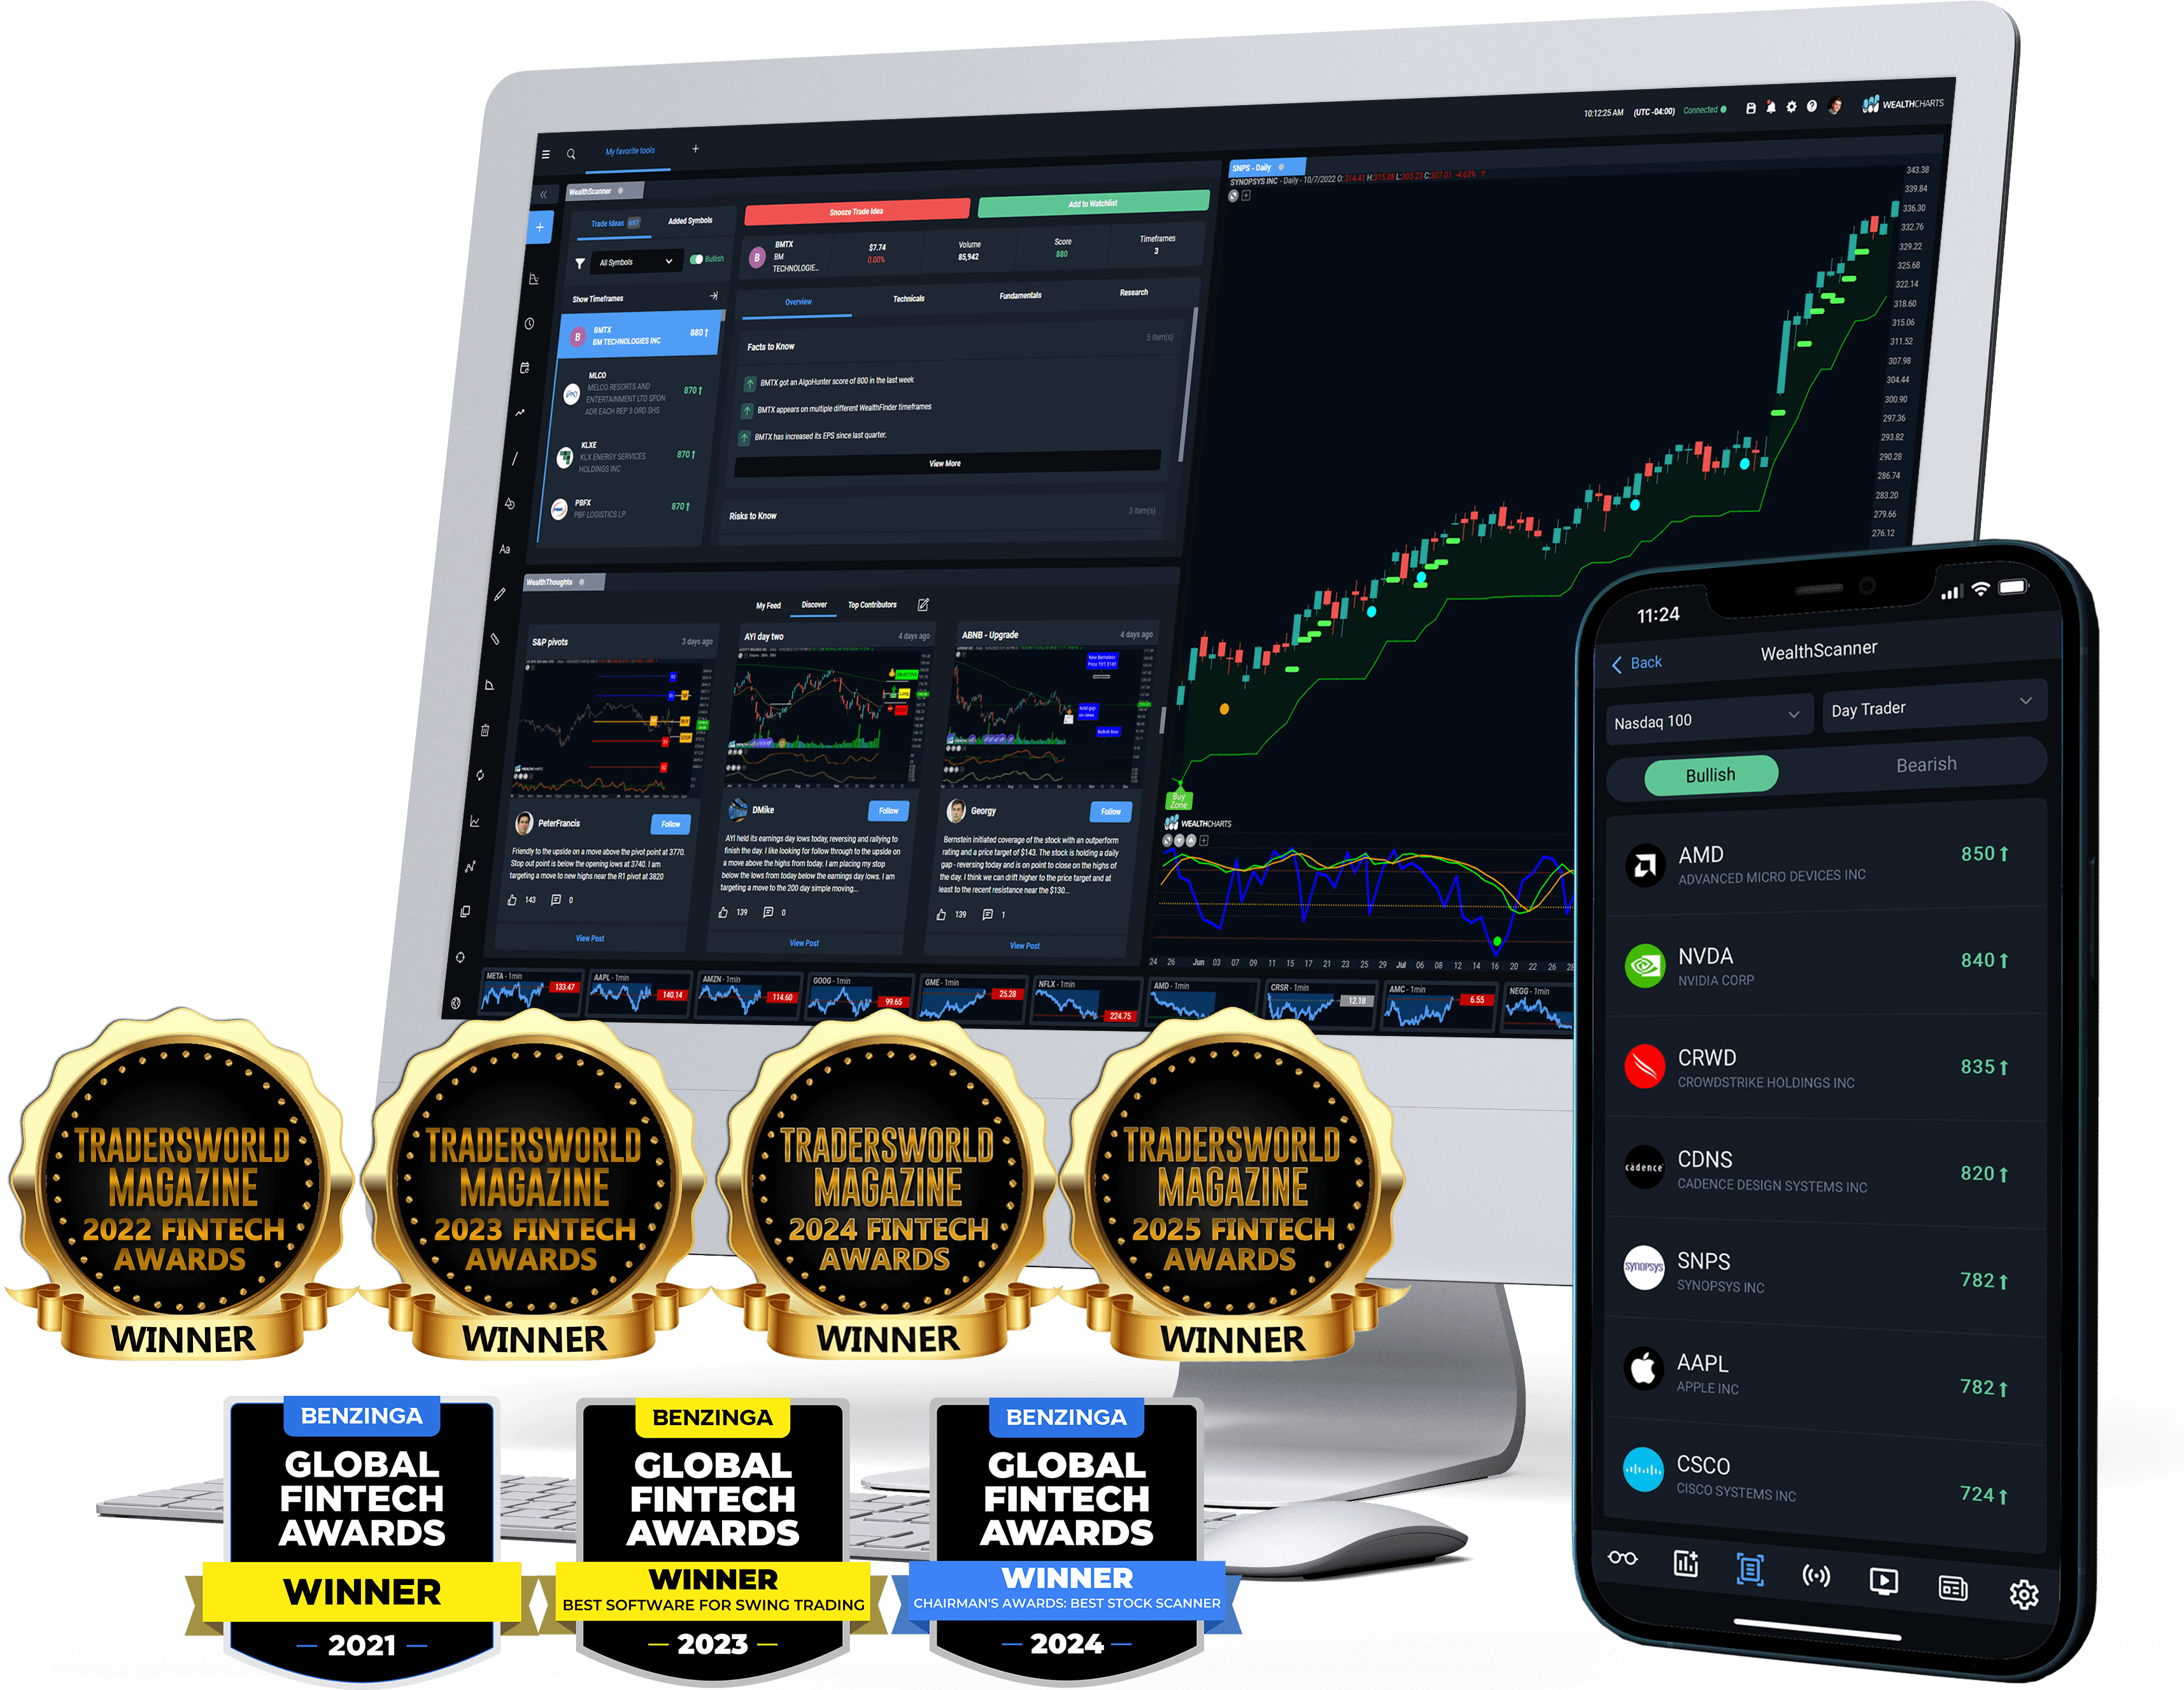
The Next Generation Of Trading Research, Analysis, And Execution Has Arrived, And It's Starting A Revolution
WealthCharts brings cutting-edge tools, competition tested strategies, and automated algorithmic analysis to retail traders - giving them every advantage possible when they need it most.
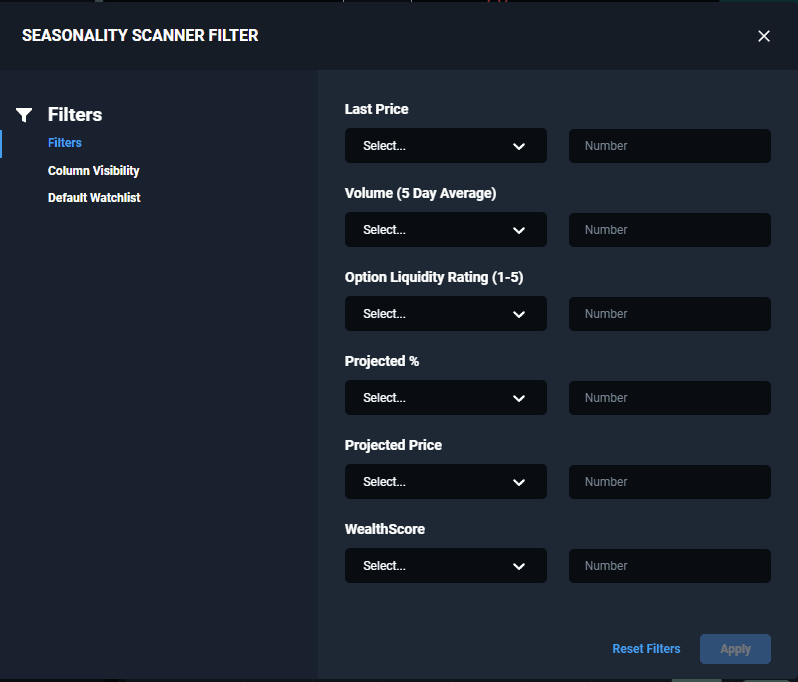
Narrow Your Results To Find The Best Opportunities For You
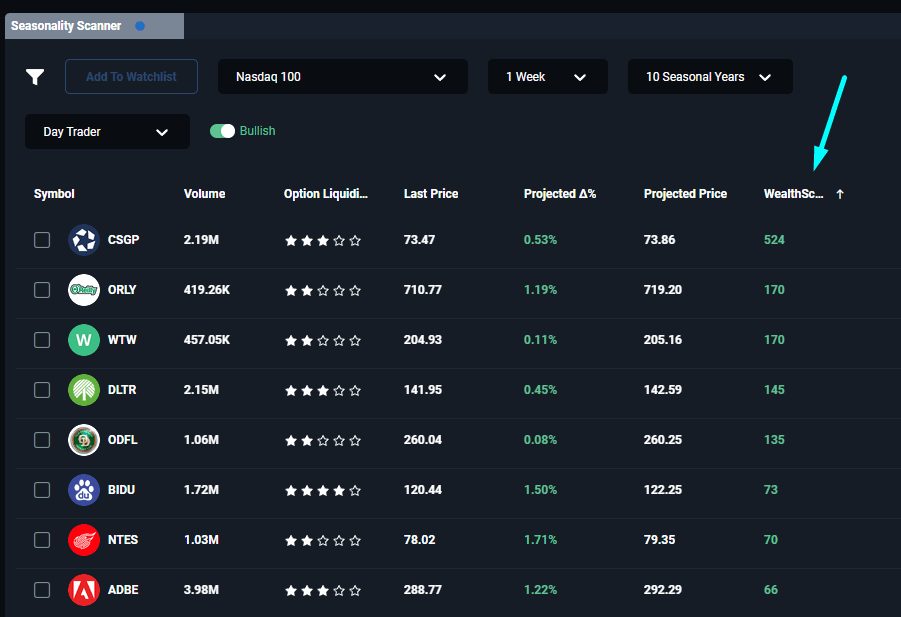
Algorithmic Scoring and Watchlist Scanner For Faster Analysis
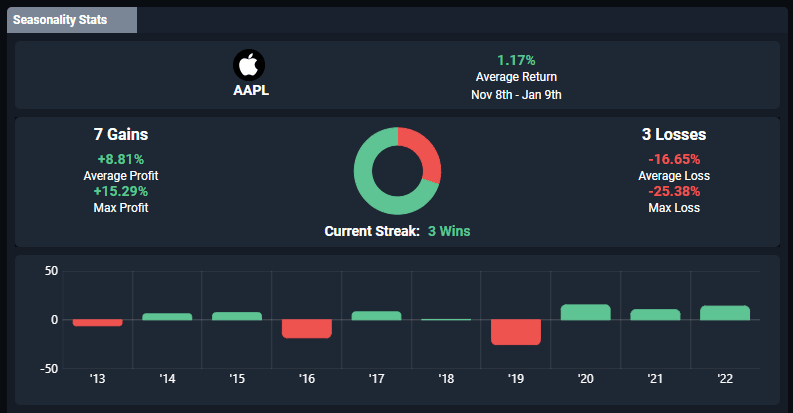
Compare Year To Year Performance At A Glance
Easily Add Seasonal Analysis To Your Charts
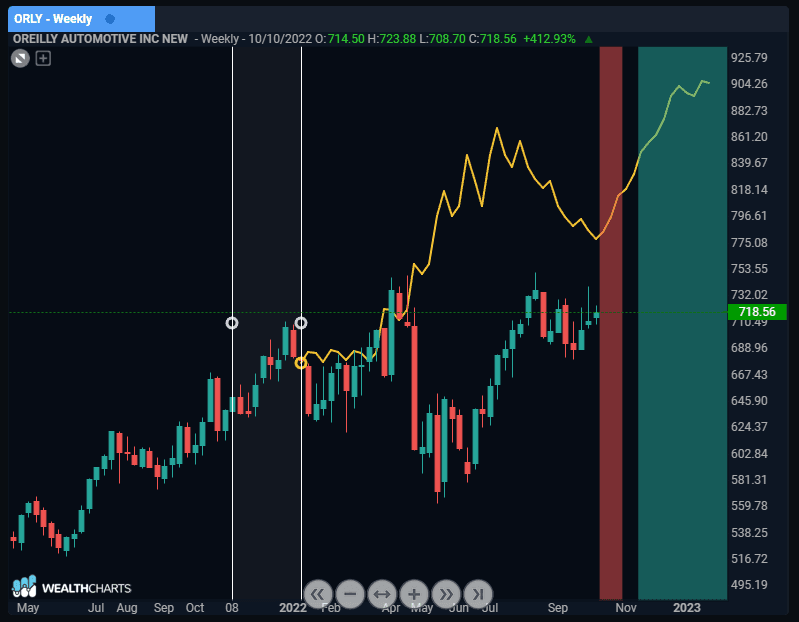
All The Seasonality Tools You Need In One Platform
WealthCharts has made it easier than ever to quickly identify strong seasonal patterns, compare the expected pattern performance on a chart with your favorite indicators, and review the historical performance of the pattern over the past 10 years. Whether you are looking for short term trades or long term investments, Seasonality can help find opportunities that fly under the radar of the average trader.